
ELE-280 · Lesson 12 of 12 · 21 min
Lab notebooks and technical reports
A measurement that is not recorded properly is a measurement that has to be made again. Worse, a result reported without its conditions, uncertainty and method can mislead whoever relies on it. Engineering labs therefore insist on two kinds of writing: the lab notebook, a running record made at the bench while the work happens, and the technical report, a structured document written afterwards that presents the results and the reasoning to someone who was not there. This last lesson covers both, along with fitting data to a model, presenting graphs and tables, and the habits that make your records trustworthy. It ends with Leo's report on the controller prototype tests.
At the end of the term, Amara asks Leo to write up the verification of the pedestrian controller's prototype boards: the supply, the LED drivers, the input conditioning and the temperature sensing, with the results of the chamber test. The report will go to the design team, to Cedarline's quality records and, eventually, to the municipal customers who buy the controller.
The lab notebook
A lab notebook records what you did, what you observed and what you thought at the time, in the order it happened. It is written during the work, not reconstructed afterwards from memory. Each entry starts with the date and a short statement of purpose, lists the equipment used with model and serial or asset numbers and calibration due dates, sketches the circuit or setup with the measurement points marked, and then records the readings directly, with units, as they are taken. Observations and surprises go in too, along with the reasoning behind each decision: 'reading drifted for 2 min after power-up; waited until stable before recording' is the kind of note that explains an odd result months later.
| Notebook element | Why it matters |
|---|---|
| Date, purpose and setup sketch | Lets anyone, including you, reconstruct the conditions later |
| Instrument list with IDs and calibration dates | Establishes traceability and lets errors be traced to a faulty instrument |
| Raw readings with units, as taken | Raw data can be re-analyzed; summarized data cannot |
| Settings: ranges, coupling, timebase, filters | Many surprises are explained by a setting |
| Observations, problems and changes | Explains anomalies and records what was tried |
| Calculations or references to scripts and data files | Makes the analysis reproducible |
Many organizations, including Cedarline, use an electronic notebook or a version-controlled project folder instead of paper, which makes it easy to attach scope captures, data files and scripts. The principles are the same. Entries are never deleted or overwritten: a mistake is struck through or marked as superseded, with the correction beside it, so that the record shows what really happened. In research and product development, notebooks can also serve as evidence of when an idea was conceived or a test performed, which is another reason to date entries and keep them complete.
Fitting data to a model
Much lab analysis consists of comparing measurements with a model: a straight line through voltage and current that gives a resistance, an exponential decay that gives a time constant, a calibration curve that relates a sensor's output to temperature. The standard method for a straight line y = mx + b is least squares, which chooses the slope and intercept that minimize the sum of the squared vertical distances between the points and the line. It also gives the uncertainty of the slope and intercept from the scatter of the points, and the residuals, the differences between the data and the fitted line, which should look like random noise if the model is right.
Always plot the residuals. A curve in the residuals means the model is wrong, for example a resistor heating as the current rises so that its resistance increases. One point far from the others suggests a recording error or a real event worth investigating; it should be checked, not silently deleted. The coefficient of determination, R², is often quoted, but a value of 0.999 does not prove the model is right: a slightly curved relationship can still give a very high R². The residual plot tells you more.
# Least-squares line through the LED driver's current-sense data, with slope uncertainty
import math, statistics as st
# Programmed LED current setpoint (mA) and measured sense voltage (mV)
x = [50, 100, 150, 200, 250, 300, 350]
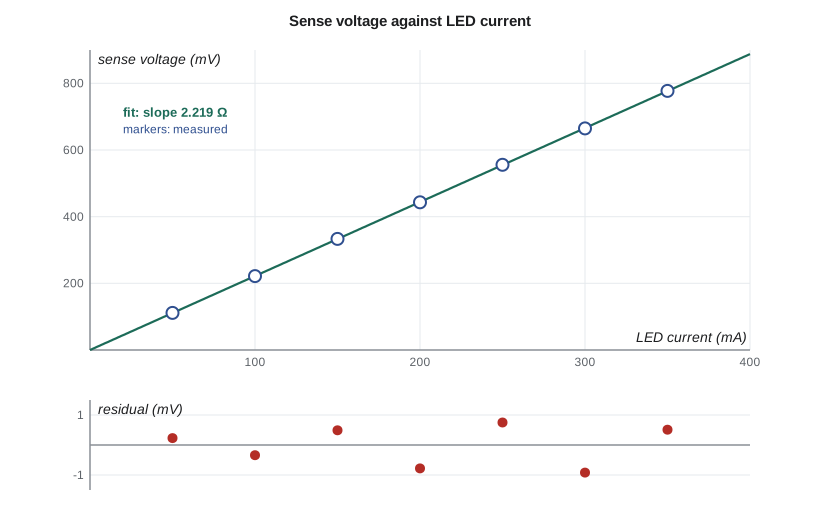
y = [111.2, 221.6, 333.4, 443.1, 555.6, 664.9, 777.3]
n = len(x)
sx, sy = sum(x), sum(y)
sxx = sum(v * v for v in x); sxy = sum(a * b for a, b in zip(x, y))
m = (n * sxy - sx * sy) / (n * sxx - sx ** 2)
b = st.mean(y) - m * st.mean(x)
res = [yi - (m * xi + b) for xi, yi in zip(x, y)]
s_res = math.sqrt(sum(r * r for r in res) / (n - 2))
s_m = s_res * math.sqrt(n / (n * sxx - sx ** 2))
s_b = s_res * math.sqrt(sxx / (n * sxx - sx ** 2))
ss_tot = sum((yi - st.mean(y)) ** 2 for yi in y)
r2 = 1 - sum(r * r for r in res) / ss_tot
print(f"slope m = {m:.4f} +/- {s_m:.4f} ohm (mV per mA), intercept b = {b:.2f} +/- {s_b:.2f} mV, R^2 = {r2:.6f}")
print("residuals (mV):", ", ".join(f"{r:+.2f}" for r in res))slope m = 2.2194 +/- 0.0028 ohm (mV per mA), intercept b = -0.00 +/- 0.62 mV, R^2 = 0.999992 residuals (mV): +0.23, -0.34, +0.50, -0.77, +0.76, -0.91, +0.52
The fit gives a slope of about 2.219 Ω, which is the sense resistor's effective value including any gain error in the driver's current setting, in close agreement with the four-wire measurement of 2.218 Ω in lesson 8. The intercept is essentially zero, 0.0 ± 0.6 mV. The residuals scatter between about −0.9 and +0.8 mV, alternating in sign with no curve, so the straight-line model fits. Leo reports the slope with its uncertainty and includes the residual plot in an appendix.
Graphs and tables that communicate
A good graph shows the data, not the decoration. Label both axes with the quantity and its unit, for example 'LED current (mA)'. Plot measured data as markers, and draw fitted models or theory as lines, so the reader can see which is which. Show error bars when the uncertainty is significant relative to the scale. Choose logarithmic axes when the data span several decades, as frequency responses and thermistor curves do. Start the vertical axis at zero when the reader will compare magnitudes; do not, when the interest is in small variations around a large value. Give every graph and table a number and a caption that says what it shows, and refer to it in the text. Tables are better than graphs when the reader needs exact values; graphs are better for trends and comparisons.
Structure of a technical report
A technical report follows a structure that lets different readers find what they need quickly. A manager may read only the summary; a designer will read the results and discussion; someone repeating the test will need the method in full. Write the summary last, after you know what the results mean.
| Section | Content |
|---|---|
| Title and identification | Report title, author, date, project, document number and revision |
| Summary (abstract) | One paragraph: what was tested, how, the key results with numbers, and the conclusion |
| Introduction | Purpose, background and the requirements or questions the test addresses |
| Method | Setup, equipment with IDs and calibration status, procedure and conditions, in enough detail to repeat |
| Results | Measured values with uncertainties, in tables and graphs, without interpretation |
| Discussion | What the results mean, comparison with requirements and theory, sources of error, anomalies |
| Conclusions and recommendations | Clear answers to the questions in the introduction, and actions |
| References and appendices | Data sheets, standards cited, raw data, scripts and extra plots |
In engineering practice in Canada, reports that carry engineering judgement are often reviewed and authenticated by a professional engineer, and the reasoning has to stand on the page. Leo's report will be checked by Amara and approved by Daniel Fortin, a P.Eng., before it goes into Cedarline's quality records.
Writing style for technical reports
Technical writing aims to be clear, specific and honest. Use numbers instead of adjectives: 'the ripple was 0.21 V RMS, within the 0.5 V limit' rather than 'the ripple was low'. State results with uncertainties and units, rounded consistently, as lesson 2 described. Use the past tense for what was done and the present tense for what is generally true. Distinguish clearly between what you measured, what you calculated and what you assumed. Report problems and anomalies rather than hiding them: a test that partly failed, an instrument that drifted, a point that did not fit. A reader can work with an honest limitation, but cannot work with a result that was quietly adjusted. Cite data sheets and standards by name and edition, and credit any data, figures or code that are not your own.
Worked problem
Writing the summary
Leo's draft summary reads: 'We tested the controller and it worked well. The LED current was good and the temperature sensor was accurate. There were some resets but we fixed them.' Rewrite it to the standard of a technical report.
Show solution
- Replace every adjective with a number and a criterion: what 'worked well', 'good' and 'accurate' mean.
- Say what was tested, under what conditions and against which requirements.
- State the fault and the fix specifically, and whether the fix was verified.
Answer: 'Three prototype pedestrian controller boards (revision B) were tested on the bench and over a seven-day chamber cycle from −40 °C to 70 °C. The LED drive current was 188.5 ± 0.4 mA (k = 2) against a target of 190 ± 10 mA, and the 24 V rail ripple was 0.21 V RMS against a 0.5 V limit. The cabinet thermistor agreed with a reference RTD to within 0.4 °C over the range. Random resets on board 3 were traced to noise coupled into the reset line when all signal heads switched on; a 100 nF reset filter and staggered head switching eliminated them over 2,000 cold-start cycles. The design meets its electrical requirements, subject to the two changes being adopted in revision C.'
Integrity in measurement
The value of everything in this course depends on honesty. Record the readings you actually got, not the ones you expected. Do not discard data because it is inconvenient; if a point is excluded, say which and why. Do not copy results from another group or from a previous year's report. Do not adjust a calibration factor until the result matches the answer you wanted. In industry, falsified test results can put unsafe products into public use, and in a traffic controller they could put pedestrians at risk. Professional engineering codes of ethics in both Canada and the United States treat honest reporting of results as a basic duty, and universities treat fabricating or falsifying data as serious academic misconduct.
Common mistakes
MistakeWriting the notebook up afterwards from memory.
InsteadRecord readings, settings and observations at the bench as they happen.
MistakeRecording only processed results.
InsteadKeep the raw readings and the settings; processed data cannot be re-analyzed.
MistakeJudging a fit only by R².
InsteadPlot the residuals; a curve in them shows the model is wrong even when R² is high.
MistakeUsing adjectives instead of numbers in conclusions.
InsteadGive values with uncertainties and compare them with stated requirements.
MistakeDeleting points that do not fit.
InsteadInvestigate them, and if a point is excluded, report it and the reason.
Summary and key terms
- A lab notebook records purpose, setup, instruments, raw readings, settings and observations, as they happen, without deletions.
- Least squares fits a line by minimizing squared residuals and gives uncertainties for slope and intercept.
- Residual plots reveal model errors and outliers better than R².
- Good graphs label axes with units, show data as markers and models as lines, and use captions.
- A technical report has a summary, introduction, method, results, discussion, conclusions and appendices, written for different readers.
- Clear, specific, honest writing and complete records are part of measurement integrity.
- Lab notebook
- A dated, chronological record of experimental work made while the work is done.
- Least squares
- A fitting method that chooses model parameters to minimize the sum of squared differences between data and model.
- Residual
- The difference between a measured value and the value predicted by a fitted model.
- Coefficient of determination (R²)
- The fraction of the variance in the data explained by a fitted model.
- Technical report
- A structured document presenting the purpose, method, results and conclusions of technical work.
- Summary (abstract)
- A short paragraph giving the purpose, method, key numerical results and conclusion of a report.
- Reproducibility
- The ability of someone else to repeat a measurement or analysis and obtain consistent results.
Practice problems
Work each problem on paper first, then reveal the answer to check.
Name three things a notebook entry should record about the instruments used.
Show answer
Model, serial or asset number, and calibration due date; also settings and ranges.
A fit has R² = 0.9995 but the residuals form a clear arch. What does that mean?
Show answer
The straight-line model is wrong; there is curvature the line does not capture.
Which report section should contain interpretation of the results?
Show answer
The discussion, not the results section.
Rewrite 'the noise was small' in a technical style.
Show answer
For example: 'the noise was 1.2 mV RMS in a 20 MHz bandwidth, below the 5 mV requirement.'
Why should a mistaken entry be struck through rather than erased?
Show answer
So the record shows what actually happened, which preserves its integrity.
When should a logarithmic axis be used?
Show answer
When the data span several orders of magnitude, such as frequency responses.
Lesson quiz · 5 questions
Score 60% or more to complete this lesson.
Create a free account to save your progress, take quizzes and earn a certificate.