
DCT-340 · Lesson 5 of 12 · 19 min
Infrared, ultrasound and other condition monitoring
Lesson 2 described predictive maintenance: measuring the condition of equipment and acting when the measurements show it deteriorating. This lesson looks at the measurements themselves. Most of them are taken by specialists, an electrical testing company for infrared scans, a vibration analyst for rotating machines, a laboratory for oil samples, but the site technician arranges them, supervises them, reads their reports and, for some, takes the readings himself. Jamal also learns that the most useful condition monitoring on the campus happens without any special instrument: the rounds of Lesson 1, where a technician who knows what normal looks, sounds and smells like notices the first sign of change.
Infrared thermography
Every electrical connection has a little resistance, and current through resistance makes heat. A good connection makes very little. A loose, corroded or damaged connection has more resistance, so it runs hotter, and the extra heat makes it worse: metal expands and contracts, oxidation increases, the resistance rises further. Eventually the connection fails, sometimes by burning open, sometimes by arcing into a fault. Infrared thermography finds these connections while they are still only warm. An infrared camera sees the heat radiated from surfaces and shows it as an image in which temperature differences stand out.
Infrared scanning of switchgear, distribution units, panels, busways and UPS systems is one of the highest-value maintenance tasks in a data centre. NFPA 70B's 2023 edition requires it at least annually for electrical equipment and more often for equipment in poor condition, as Lesson 3 described. Stonebridge scans its critical electrical equipment twice a year and its busway joints in Hall D, where loads are high, every quarter.
Three conditions make a scan meaningful. The equipment must be carrying a reasonable load, because a bad joint carrying little current makes little heat; scans are planned when load is high, and the scanner records the load at the time. The camera must see the surface, which means either looking through infrared windows fitted to the equipment covers or having covers removed. And the reading must account for the surface: shiny bare metal reflects heat and gives low, misleading readings, while painted or taped surfaces read well. Thermographers set the camera for the surface's emissivity and often compare similar components rather than trusting the absolute temperature.
Removing covers from energized switchgear exposes live parts and arc-flash hazard, as DCT-120 described. Only qualified electrical workers in the required protective equipment open energized equipment, and the scan is planned as energized work. Infrared windows, fitted to many of the newer covers on the campus, let the scan be done with the covers closed, which is safer and quicker. Jamal's role in a scan is to plan it with the testing company, escort the thermographer, record the loads, keep the approach boundaries clear and make sure every finding becomes a work order.
Reading infrared findings
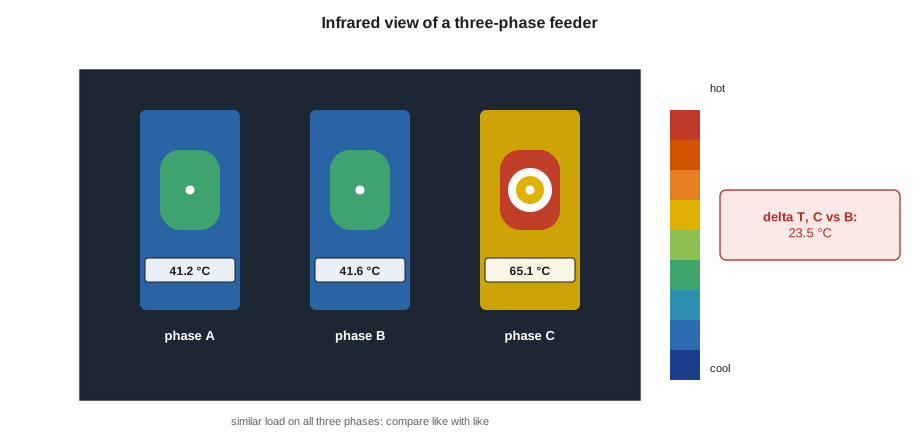
A thermographer reports each finding with its temperature rise and a severity. Most severity schemes compare the hot component either with a similar component under similar load, such as the same connection on the other two phases, or with the surrounding air. Comparing similar components is preferred because it cancels out the effect of load and room temperature. The criteria commonly quoted from the NETA maintenance testing specification are summarized below; the testing company's report will name the criteria it used.
| Temperature rise | Compared with similar component | Compared with ambient air | Typical action |
|---|---|---|---|
| Small | 1 to 3 °C (2 to 5 °F) | 1 to 10 °C (2 to 18 °F) | Possible deficiency: investigate when convenient |
| Moderate | 4 to 15 °C (7 to 27 °F) | 11 to 20 °C (20 to 36 °F) | Probable deficiency: repair as time permits, monitor |
| Serious | 21 to 40 °C (38 to 72 °F) | Monitor until corrective measures can be made | |
| Critical | over 15 °C (over 27 °F) | over 40 °C (over 72 °F) | Major discrepancy: repair immediately |
# Classify infrared findings by temperature rise over a similar component (criteria as in the table)
findings = [  # location, hot reading, similar component reading, load % at scan
    ("SWBD-A2 feeder 4 phase C lug", 61.5, 38.0, 62),
    ("PDU-B2-05 main input phase A", 41.0, 38.5, 48),
    ("BW-D3-A joint 7", 52.0, 43.0, 81),
    ("RPP-A2-03 breaker 17", 34.2, 33.6, 55),
]
limits = [(3.0, "possible: investigate"), (15.0, "probable: repair as time permits"), (999, "critical: repair immediately")]
for where, hot, ref, load in findings:
    dt = hot - ref
    action = next(text for top, text in limits if dt <= top)
    if dt < 1.0:
        action = "no finding"
print(f"{where:31} rise {dt:4.1f} C at {load} % load -> {action}")SWBD-A2 feeder 4 phase C lug rise 23.5 C at 62 % load -> critical: repair immediately PDU-B2-05 main input phase A rise 2.5 C at 48 % load -> possible: investigate BW-D3-A joint 7 rise 9.0 C at 81 % load -> probable: repair as time permits RPP-A2-03 breaker 17 rise 0.6 C at 55 % load -> no finding
The phase C lug on feeder 4 of SWBD-A2 is the one that matters: a rise well past the critical level on a feeder carrying a large part of the A side. Morgan raises an emergency work order. Because the feeder can be taken out of service while the B side carries its load, the electrical contractor de-energizes it under a method of procedure two days later, finds the lug's bolt loose and its surface discoloured, replaces the lug, torques it to specification and the next scan shows it cool. The busway joint in Hall D, a probable deficiency, is scheduled for the next window and rescanned weekly until then.
Ultrasound
Many faults make sound at frequencies above human hearing. An airborne ultrasound detector converts these sounds down into the audible range so the technician can hear them in headphones and measure their level. In a data centre it has three main uses. In electrical equipment, it hears the crackle and buzz of partial discharge, tracking and arcing, especially in medium-voltage switchgear, sometimes before they make enough heat for infrared to see, and it can be used through vents with covers closed. In mechanical systems, it hears the hiss of leaks in compressed air, refrigerant and pressurized water lines. And on bearings, it hears the friction of a bearing that needs grease, which lets technicians grease by condition rather than by calendar and avoid over-greasing, itself a common cause of bearing failure.
Stonebridge's technicians carry an ultrasound detector on some rounds and use it on the medium-voltage switchgear in the substation building, on the generators' compressed-air starting systems at YUL-2 and on the pump and fan bearings. A sound that changes from round to round is the signal; as with all trend measurements, the value of each reading comes from comparing it with the last.
Vibration analysis
Rotating machines, such as pumps, fans, compressors, motors and the generators' engines, vibrate, and the way they vibrate changes as faults develop. Imbalance, misalignment, looseness, bearing wear and gear damage each leave a pattern in the vibration spectrum that an analyst can recognize, as in Lesson 2's pump bearing example. Vibration monitoring at Stonebridge has two levels. Critical machines such as the chilled-water and condenser-water pumps and the cooling tower fans have permanent sensors that send an overall vibration level to the monitoring system. A contractor collects detailed spectra on a route every quarter.
Technicians mostly see the overall level, a single number in millimetres per second (inches per second) of vibration velocity. International standards for machine vibration group levels into zones, from new-machine condition through acceptable for long-term operation to levels that call for action or shutdown. The exact zone limits depend on the machine's size and mounting, so each machine's alarm settings come from the standard and the manufacturer. What matters most for a technician is the trend: a machine whose vibration has doubled since its baseline is changing, even if it is still in an acceptable zone.
# Vibration trend alarm: flag a machine when its overall level rises well above its own baseline
readings = {  # machine: quarterly overall velocity readings, oldest first
    "CHWP-1": [1.8, 1.9, 1.8, 2.0, 1.9],
    "CHWP-2": [1.7, 1.8, 2.4, 3.1, 3.9],
    "CTF-3":  [2.6, 2.5, 2.9, 3.4, 4.1],
}
alarm_ratio = 2.0      # flag at twice the baseline
alert_level = 4.5  # absolute alert level from the alarm settings
for m, r in readings.items():
    base = sum(r[:2]) / 2
    last = r[-1]
    ratio = last / base
    flag = "trend alarm" if ratio >= alarm_ratio else ("watch" if ratio >= 1.5 else "steady")
    if last >= alert_level:
        flag += ", above alert level"
print(f"{m:7} baseline {base:.2f}, latest {last:.2f} mm/s ({ratio:.1f}x) -> {flag}")CHWP-1 baseline 1.85, latest 1.90 mm/s (1.0x) -> steady CHWP-2 baseline 1.75, latest 3.90 mm/s (2.2x) -> trend alarm CTF-3 baseline 2.55, latest 4.10 mm/s (1.6x) -> watch
Pump CHWP-2 has more than doubled from its baseline, though it is still below the alert level, and goes to the analyst for a spectrum. Fan CTF-3 has risen by more than half and is watched more closely. Neither would have raised an alarm on an absolute setting yet, which is the point of trending.
Batteries: ohmic trending
The UPS batteries are among the most critical and most failure-prone components on the campus, and they give little warning to ordinary inspection. A VRLA battery can look perfect and hold its float voltage while its capacity is falling. The best everyday indicator of a deteriorating VRLA block is its internal ohmic value, measured as impedance, conductance or resistance with a handheld tester or by the battery monitoring system. As a block ages or develops a fault, its internal resistance rises.
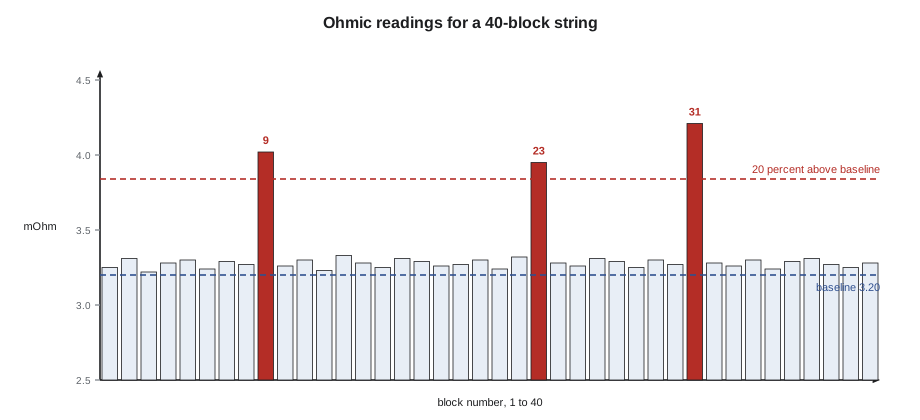
Following the IEEE practices of Lesson 3, Stonebridge measures every block's ohmic value quarterly with its battery monitoring system and compares it with the block's own baseline, set when the string was new, and with the average of the string. A block that has risen about 20 percent above its baseline is flagged for investigation, and the planner schedules a capacity test of the string if several blocks are drifting. A failing block can be replaced individually early in a string's life; when many are failing, the string is nearing the end and replacement of the whole string is planned.
# Battery string ohmic check: flag blocks more than 20 % above their own baseline, and drifting strings
baseline = 3.20   # milliohm, from commissioning, same for every block in this string
string = [3.25, 3.31, 3.22, 3.28, 3.30, 3.24, 3.29, 3.27, 4.02, 3.26,
          3.30, 3.23, 3.33, 3.28, 3.25, 3.31, 3.29, 3.26, 3.27, 3.30,
          3.24, 3.32, 3.95, 3.28, 3.26, 3.31, 3.29, 3.25, 3.30, 3.27,
          4.21, 3.28, 3.26, 3.30, 3.24, 3.29, 3.31, 3.27, 3.25, 3.28]
flag = [(i + 1, r) for i, r in enumerate(string) if r > baseline * 1.20]
avg = sum(string) / len(string)
print(f"string average {avg:.2f} mOhm ({(avg / baseline - 1) * 100:+.1f} % vs baseline)")
for block, r in flag:
    print(f"block {block:2}: {r:.2f} mOhm ({(r / baseline - 1) * 100:+.0f} %) -> investigate, check its voltage and temperature")
if len(flag) >= 3:
print("three or more blocks drifting: schedule a capacity test of the string")string average 3.34 mOhm (+4.2 % vs baseline) block 9: 4.02 mOhm (+26 %) -> investigate, check its voltage and temperature block 23: 3.95 mOhm (+23 %) -> investigate, check its voltage and temperature block 31: 4.21 mOhm (+32 %) -> investigate, check its voltage and temperature three or more blocks drifting: schedule a capacity test of the string
Three blocks out of forty exceed the trigger. Stonebridge's rule is that three or more flagged blocks in one string call for a capacity test, so the code recommends one. When the test is done a month later under a method of procedure, with the UPS on its partner side's protection, the string delivers 87 percent of its rated capacity, still above the replacement point, and the three blocks are replaced. Morgan adds a note to the string's record: replacement of the whole string to be budgeted for within two years.
Oil, coolant and fuel analysis
The generators' engines, the chillers' compressors and some gearboxes are monitored by sampling their fluids. A small sample of engine oil sent to a laboratory shows wear metals that point to which part of the engine is wearing, coolant or fuel in the oil that points to a leaking gasket or injector, and the condition of the oil itself. Coolant samples show whether its inhibitors are still protecting the engine. Diesel fuel stored for long periods is sampled for water, microbial growth and degradation, as DCT-220 described, because bad fuel is one of the commonest causes of a generator failing to start or stopping under load. These samples are usually taken by the generator vendor during scheduled visits, and the results go to the planner.
The monitoring system as a sensor
Finally, the building management and power monitoring systems of DCT-330 are condition monitoring tools in their own right, because they record thousands of points continuously. A UPS whose efficiency has slowly fallen, a CRAH whose fan power has crept up for the same airflow, a pump whose current has risen at the same flow, a CDU whose approach temperature has widened, as in DCT-230: each is a trend that points to a developing problem. Morgan reviews a set of such trends every month, and technicians are encouraged to bring her anything that looks different from last month.
| Method | What it finds | Typical interval at Stonebridge |
|---|---|---|
| Infrared thermography | Hot electrical connections, overloaded parts, blocked cooling | Twice a year for critical electrical; quarterly for Hall D busways |
| Airborne ultrasound | Partial discharge, tracking, arcing, leaks, dry bearings | On rounds and quarterly for medium voltage |
| Vibration | Imbalance, misalignment, looseness, bearing and gear wear | Continuous overall level on critical machines; quarterly spectra |
| Battery ohmic readings | Ageing or failing blocks | Quarterly, with continuous monitoring of voltage and temperature |
| Oil, coolant and fuel analysis | Engine wear, leaks, degraded fluids, contaminated fuel | At each generator service; fuel every six months |
| Monitoring trends | Slow changes in efficiency, power, flow or temperature | Continuous; reviewed monthly |
Common mistakes
MistakeScanning equipment that is lightly loaded and reporting it as healthy
InsteadScan at representative load and record the load with each finding
MistakeTrusting an absolute infrared reading on bare, shiny metal
InsteadAllow for emissivity and compare with similar components under similar load
MistakeOpening energized switchgear covers for a scan without qualification and protective equipment
InsteadOnly qualified electrical workers open live equipment, or use infrared windows
MistakeJudging a battery by its float voltage alone
InsteadTrend each block's ohmic value against its baseline and test capacity when blocks drift
MistakeWaiting for an absolute vibration alarm
InsteadWatch each machine's trend against its own baseline
Summary and key terms
- Loose or damaged electrical connections run hot; infrared thermography finds them at representative load.
- Severity is judged by the temperature rise over a similar component or over ambient, using criteria such as NETA's.
- Ultrasound hears partial discharge, leaks and dry bearings; vibration analysis finds faults in rotating machines.
- VRLA blocks are trended by ohmic value; about 20 percent above baseline flags a block, and drifting strings get capacity tests.
- Oil, coolant and fuel samples show engine wear and fluid condition; monitoring trends reveal slow changes.
- In every method, the trend against the item's own history is more telling than any single reading.
- Infrared thermography
- Imaging the heat radiated from surfaces to find abnormal temperatures.
- Emissivity
- How well a surface radiates heat; shiny metal has low emissivity and reads low.
- Infrared window
- A port in an equipment cover that lets an infrared camera see inside with the cover closed.
- Partial discharge
- Small electrical discharges in insulation that precede insulation failure.
- Ohmic value
- A battery block's internal impedance, conductance or resistance, which rises as it deteriorates.
- Vibration velocity
- The speed of a machine surface's vibration, used as an overall measure of machine condition.
- Baseline
- The reading taken when an item was new or known good, used for comparison.
Practice problems
Work each problem on paper first, then reveal the answer to check.
Phase C of a lug reads 49 °C and phases A and B read 37 °C under the same load. How is it classified with the criteria in this lesson?
Show answer
A rise of 12 °C over a similar component: a probable deficiency, repair as time permits.
Why must an infrared scan be done at representative load?
Show answer
A bad connection carrying little current makes little heat and may be missed.
A block's ohmic value has risen from 3.0 to 3.7 milliohm. Is it flagged?
Show answer
Yes. It is about 23 percent above baseline, past the 20 percent trigger.
Name two things ultrasound can find in a data centre.
Show answer
Any two of: partial discharge or arcing, compressed air or refrigerant leaks, bearings needing lubrication.
Lesson quiz · 5 questions
Score 60% or more to complete this lesson.
Create a free account to save your progress, take quizzes and earn a certificate.