
CRE-302 · Lesson 3 of 12 · 31 min
Ad revenue economics: CPM, RPM and seasonality
Two creators with the same number of views can earn very different amounts of ad revenue. One may earn $2 per thousand views and the other $20, because of differences in topic, audience location, viewer age, video length, ad formats, time of year and how many of their views actually show ads. Understanding the economics behind these differences helps creators forecast income, decide what to make, and avoid misleading comparisons. This lesson explains the key metrics, CPM, RPM and monetized playbacks, the factors that drive advertiser demand, seasonality, the effect of video length and mid-roll ads, and how to forecast ad income. Revenue analytics dashboards were introduced in CRE-202; here the focus is on the economics underneath them.
CPM and RPM
Advertisers buy ad space in units of a thousand impressions. CPM (cost per mille) is what advertisers pay per thousand ad impressions. On YouTube, Studio reports a playback-based CPM, the gross revenue per thousand monetized playbacks, before YouTube's share. RPM (revenue per mille) is what the creator earns per thousand views of their content, after the platform's share and including all views, whether or not they showed ads, and including other revenue sources such as memberships and Premium revenue.
RPM is the more useful number for creators, because it reflects what they actually receive per view. RPM is always lower than CPM, typically by about half or more, because the creator receives only a share of the revenue, not every view shows an ad, and some views come from regions where ads pay little.
Worked problem
From CPM to RPM
A channel's playback-based CPM is $12, the creator share is 55 %, and 60 % of views are monetized playbacks. Assuming one ad impression per monetized playback, estimate the RPM from ads.
Show solution
- Start with CPM: $12 per thousand monetized playbacks.
- Apply the share: $12 × 0.55 = $6.60.
- Apply the monetized fraction: $6.60 × 0.60 = $3.96.
Answer: An ad RPM of about $3.96 per thousand views, a third of the headline CPM.
What drives advertiser demand
CPMs vary because advertisers value some audiences more than others. Important factors include:
- Topic and niche: content about finance, business, software, insurance, real estate and some technology products attracts advertisers selling high-value products, and often has much higher CPMs than general entertainment, gaming or content for children.
- Audience location: viewers in countries with large advertising markets, such as the United States, Canada, the United Kingdom and Australia, typically generate higher CPMs than viewers in smaller ad markets.
- Audience age and buying power: adult audiences with disposable income are worth more to many advertisers than very young audiences. Content made for children is subject to special rules that limit personalized ads and reduce revenue.
- Device and format: views on connected TVs and desktops may attract different rates than mobile views; Shorts and other short-form feeds have generally produced lower RPMs than long-form video.
- Ad formats and placement: skippable, non-skippable, bumper and mid-roll ads, and the number shown, affect revenue.
- Advertiser-friendliness: content limited under advertiser guidelines attracts fewer advertisers.
- Competition and season: CPMs rise when many advertisers compete for the same audience.
| Factor | Tends to raise CPM | Tends to lower CPM |
|---|---|---|
| Topic | Finance, business, software, B2B | General entertainment, children's content |
| Location | Large ad markets: US, Canada, UK, Australia | Smaller ad markets |
| Audience | Adults with buying power | Young audiences, made-for-kids |
| Format | Long-form with mid-rolls | Short-form feeds |
| Season | Q4 holiday shopping | January after holidays |
| Suitability | Fully advertiser-friendly | Limited ads |
Published lists of RPM by niche circulate widely, but they come from small, self-selected samples and change from year to year. A creator's own analytics are the only reliable source for their RPM.
Seasonality
Ad rates follow a predictable yearly pattern driven by advertiser budgets. Rates are usually lowest in January, when advertisers have spent their holiday budgets and new budgets are being set, and rise through the year, with a strong peak in the fourth quarter (October to December) as retailers compete for holiday shoppers, including around Black Friday and Cyber Monday. Many advertisers also spend more at the end of each quarter. Other peaks are niche-specific: back-to-school for education and technology, tax season for finance, and summer for travel. A channel's RPM can easily double between January and December.
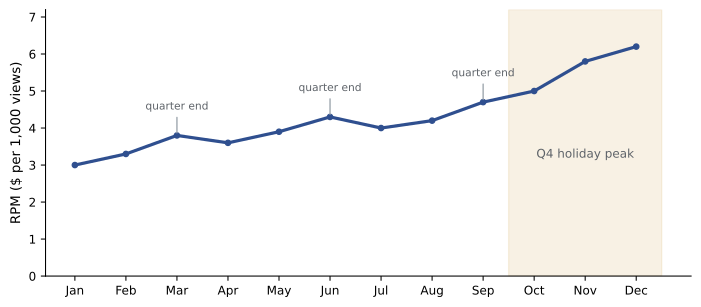
Seasonality has practical consequences. Creators can plan budgets around the January dip, schedule high-value content for the fourth quarter, and avoid concluding that a channel is failing because January revenue fell. Sponsorship prices also tend to follow the same calendar.
Video length and mid-roll ads
On YouTube, videos of eight minutes or longer can carry mid-roll ads, ads shown during the video rather than only before or after. More ad breaks can increase revenue per view, but too many or badly placed breaks drive viewers away and reduce watch time, which can reduce recommendations. Creators can choose automatic placement or set breaks manually at natural pauses. Longer videos also give more total watch time per viewer, which affects eligibility and recommendations. However, making videos longer purely to reach eight minutes, with padding that bores viewers, tends to backfire. The goal is the length the content deserves, with breaks where they interrupt least.
Revenue per viewer versus revenue per view
RPM measures revenue per thousand views, but creators can also look at revenue per viewer or per hour watched. A long video watched for twenty minutes may show several ads and earn much more per view than a short video, while a Short watched in seconds earns a fraction of a cent. Comparing formats by RPM alone can mislead, because one long video may take far more effort than ten Shorts. A more complete comparison considers revenue per hour of production effort.
Worked problem
Comparing formats by effort
A long-form video takes 20 hours to make, gets 80,000 views and has an RPM of $6. A batch of ten Shorts takes 10 hours in total, gets 2,000,000 views altogether and has an RPM of $0.08. Which earns more per production hour?
Show solution
- Long-form revenue: 80,000 × $6 / 1000 = $480; per hour: $480 / 20 = $24.
- Shorts revenue: 2,000,000 × $0.08 / 1000 = $160; per hour: $160 / 10 = $16.
Answer: The long-form video earns more per production hour, $24 against $16, though Shorts may bring growth and new subscribers that a full comparison should also count.
Forecasting ad income
A simple forecast multiplies expected views by expected RPM, adjusted for seasonality. Using the last twelve months of data captures seasonal variation; using the same month last year is a simple way to adjust for it.
Here \(V_m\) is expected views and \(\text{RPM}_m\) is expected RPM in month \(m\). Forecasts should include a range, because views and rates are uncertain. A conservative forecast, a central forecast and an optimistic forecast give a better basis for decisions than a single number. CRE-202 described how to read the dashboards that supply these inputs.
Worked problem
A seasonal forecast
A creator expects 400,000 views in January at an RPM of $4, and 500,000 views in November at an RPM of $8. What revenue should they expect in each month?
Show solution
- January: 400,000 × $4 / 1000 = $1,600.
- November: 500,000 × $8 / 1000 = $4,000.
Answer: About $1,600 in January and $4,000 in November; the difference comes mostly from the seasonal rise in RPM.
Direct ad sales and podcast advertising
Platform ad programs are not the only way to earn from advertising. Podcasts and newsletters often sell ads directly or through ad networks, priced by CPM on downloads or opens. Host-read ads, in which the creator reads the message in their own voice, usually command higher CPMs than programmatic ads, because listeners trust the host; dynamically inserted ads can be placed in back-catalogue episodes. Newsletter advertising is priced per send or per thousand opens. Direct ad sales blur into sponsorships (Lesson 5), but differ in that the ad is usually a standard placement rather than a custom integration.
Advertising in Canada is subject to the Competition Act's rules on false or misleading representations and to the Canadian Code of Advertising Standards administered by Ad Standards; certain categories, such as health products, alcohol and cannabis, have additional rules.
Improving ad revenue responsibly
Creators can improve ad revenue by making content for audiences advertisers value, keeping content advertiser-friendly, using mid-rolls thoughtfully on longer videos, publishing high-value content in strong seasons, and keeping viewers engaged so they watch more. They should avoid tactics that harm the audience, such as clickbait that disappoints, excessive ad breaks, or choosing topics purely for CPM when the creator lacks interest or expertise, which audiences usually notice. Ad revenue rewards audiences that are large, engaged and valuable to advertisers; the most reliable route to all three is content that serves viewers well.
Audience geography and RPM
Because advertising markets differ by country, a channel's audience geography strongly affects RPM. A Canadian creator whose audience is mostly in Canada and the United States will usually see higher RPMs than a creator with the same views spread across countries with smaller advertising markets. Analytics dashboards break revenue down by country, which helps explain changes in RPM: a video that goes viral in a lower-RPM region can raise views sharply while barely changing revenue. Creators who make content in more than one language sometimes see very different RPMs for each version.
Worked problem
Blended RPM by region
A video gets 200,000 views: 50 % from the US at an RPM of $8, 15 % from Canada at $7, and 35 % from other regions at an average of $1.50. What is the blended RPM and total revenue?
Show solution
- US: 100,000 × $8 / 1000 = $800.
- Canada: 30,000 × $7 / 1000 = $210.
- Other: 70,000 × $1.50 / 1000 = $105.
- Total: $800 + $210 + $105 = $1,115; blended RPM: $1,115 / 200 = $5.58.
Answer: A blended RPM of about $5.58 and revenue of $1,115.
Back catalogue and evergreen revenue
Ad revenue does not stop when a video stops being new. Evergreen videos, such as tutorials, reviews and explainers that answer lasting questions, continue to attract search and suggested traffic for years. For many established channels, a large share of monthly revenue comes from the back catalogue rather than the latest uploads. This makes ad revenue partly a function of the size and quality of the library, and it rewards creators who update or refresh popular older videos with better titles, thumbnails, chapters and end screens. It also means that a channel's revenue may be more stable than the performance of new uploads suggests.
Ad blockers, premium subscriptions and connected TVs
Not every view can show an ad. Viewers with ad blockers, or with ad-free subscriptions, generate no ad impressions, although platforms that share subscription revenue, such as YouTube Premium, pay creators a share based on subscribers' watch time. Viewing on connected TVs has grown, and longer videos watched on television screens can carry more ad breaks and attract brand advertisers used to buying television advertising. These trends change the economics of formats over time: short-form feeds bring discovery and scale, while long-form viewing on large screens often earns more per view.
Limits of optimizing for RPM
Choosing topics purely for high CPMs is tempting but often counterproductive. A cooking creator who starts making credit card videos may attract a higher-paying audience but lose the viewers who came for cooking, and a finance channel competing with experts may struggle to stand out. The most durable approach is to look for high-value angles within the creator's own niche, such as equipment reviews, buying guides or business topics relevant to the audience, rather than abandoning the niche.
Common mistakes
MistakeConfusing CPM with RPM.
InsteadRPM is what the creator earns per thousand views.
MistakeTrusting published RPM-by-niche lists.
InsteadUse your own analytics as the reliable source.
MistakePanicking at the January drop.
InsteadExpect seasonal lows and plan budgets for them.
MistakePadding videos to eight minutes for mid-rolls.
InsteadMake the length the content deserves.
MistakeComparing formats by RPM alone.
InsteadCompare revenue per production hour and growth.
Summary and key terms
- CPM is advertiser cost per thousand impressions; RPM is creator revenue per thousand views.
- RPM is lower than CPM because of the platform share and unmonetized views.
- Topic, location, audience, format and suitability drive advertiser demand.
- Rates dip in January and peak in the fourth quarter.
- Mid-rolls on longer videos can raise revenue if placed well.
- Forecast with views times RPM, adjusted for season, as a range.
- Podcasts and newsletters can sell ads directly.
- CPM
- Cost per thousand ad impressions paid by advertisers.
- RPM
- Creator revenue per thousand views.
- Monetized playback
- A view in which at least one ad is shown.
- Ad impression
- A single display of an ad.
- Seasonality
- Predictable variation in rates through the year.
- Mid-roll
- An ad shown during a video.
- Q4
- The fourth quarter, October to December.
- Host-read ad
- An ad read by the creator in their own voice.
- Dynamic insertion
- Placing ads into episodes at playback time.
- Made for kids
- Content designated for children with limited ads.
Practice problems
Work each problem on paper first, then reveal the answer to check.
Define RPM.
Show answer
Creator revenue per thousand views.
Why is RPM lower than CPM?
Show answer
Platform share, unmonetized views, regional differences.
RPM from $10 CPM, 55 % share, 50 % monetized?
Show answer
About $2.75.
Name three factors that raise CPM.
Show answer
High-value topics, large ad markets, adult audiences, Q4.
When are ad rates usually lowest?
Show answer
January.
Minimum length for YouTube mid-rolls?
Show answer
Eight minutes.
Revenue from 300,000 views at $5 RPM?
Show answer
$1,500.
Why compare revenue per production hour?
Show answer
Formats differ greatly in effort.
Why do host-read ads earn higher CPMs?
Show answer
Listeners trust the host.
What is the reliable source for your RPM?
Show answer
Your own analytics.
Lesson quiz · 5 questions
Score 60% or more to complete this lesson.
Create a free account to save your progress, take quizzes and earn a certificate.