
CRE-301 · Lesson 2 of 12 · 27 min
Growth models: funnels, flywheels and compounding
Growth is easier to manage when you have a model of where it comes from. Without one, creators chase whatever seemed to work last week, overreact to a single viral post or give up during a slow month. A model breaks growth into parts that can be measured and improved: how many new people discover you, how many stay, and how many bring others. This lesson introduces three complementary ways of thinking about growth, the funnel, the flywheel and growth loops; the arithmetic of compounding, churn and steady states; cohort analysis for retention; and the difference between growth you rent from platforms and growth you own.
The funnel
A funnel describes how people move through stages, from first exposure to a valued action, with fewer people at each step. A simple creator funnel might be: impressions, views, follows, email sign-ups, community members, paying supporters. The conversion rate between each stage tells you where people drop off. CRE-202 introduced funnels for analytics; here the purpose is strategy. Improving the weakest step often produces more growth than pushing more people into the top. If 2 % of viewers follow but only 0.5 % of followers ever see your email sign-up offer, the invitation, not the content, is the bottleneck.
Worked problem
Finding the bottleneck
In a month, a creator's videos receive 500,000 views. 1.5 % of viewers follow, 4 % of new followers join the email list, and 10 % of new subscribers join the paid community. How many paying members join? Which single improvement would add the most members: doubling the follow rate, doubling the email conversion, or doubling the paid conversion?
Show solution
- New followers: 500,000 × 0.015 = 7,500.
- New email subscribers: 7,500 × 0.04 = 300.
- New paying members: 300 × 0.10 = 30.
- Because the steps multiply, doubling any one rate doubles the result to 60 members.
- The cheapest improvement is usually the weakest-designed step; here a 4 % follower-to-email rate suggests the invitation is rarely seen or weak.
Answer: 30 paying members per month; doubling any one step gives 60, so improve whichever step is easiest to change, often the email invitation.
The flywheel
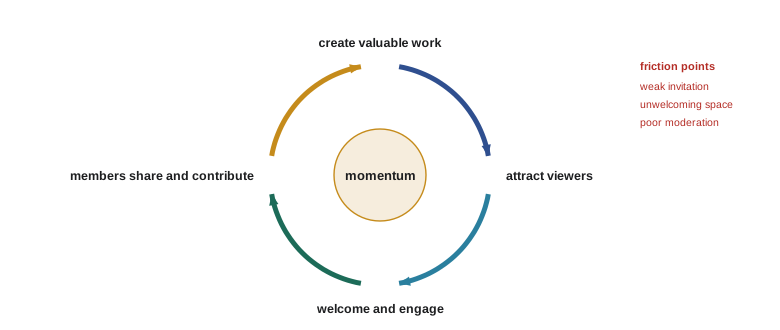
Funnels treat members as the end of a process. Flywheels, a metaphor popularized in business writing by Jim Collins and later by marketing firms, emphasize that satisfied members feed growth back into the system: they share, recommend, create content and attract others, making each turn of the wheel easier. For creators, a flywheel might look like this: good work attracts viewers; viewers who love it join the community; community members share clips, answer newcomers' questions and suggest ideas; their activity produces more and better work and more discovery. The insight is that investment in member experience is not only retention but also acquisition. Friction anywhere, such as an unwelcoming community, a confusing sign-up or poor moderation, slows the whole wheel.
Growth loops
A growth loop is a specific, repeatable mechanism by which some output of your work produces new input. Examples include:
- Content loops: a video ranks in search, brings new viewers, some of whom ask questions in comments that become new videos.
- Sharing loops: members share clips or memes from your work, which brings new viewers.
- User-generated content loops: members create their own work using your templates, challenges or tags, which spreads to their audiences.
- Referral loops: newsletter readers forward issues or use referral links, earning rewards.
- Collaboration loops: collaborators introduce you to their audiences, and you introduce them to yours (Lesson 4).
Identifying your strongest loop and strengthening it deliberately, for example by making clips easy to share, giving members a reason to forward your newsletter, or turning frequent questions into content, is often more effective than generic advice to "post more".
Compounding growth
Growth that adds a percentage each period compounds. If an audience grows by a rate \(g\) per month, after \(n\) months its size is:
A channel with 10,000 subscribers growing 5 % a month reaches about 18,000 after a year and about 32,000 after two. Doubling time is approximately \(70/(100g)\) periods, the "rule of 70", so 5 % monthly growth doubles roughly every 14 months. Compounding explains why small, consistent improvements matter and why early growth feels slow. It also warns against extrapolating short bursts: a month of 50 % growth after a viral video is unlikely to repeat.
Churn and the steady state
Growth is never only additions. Followers unfollow, subscribers unsubscribe, members cancel. If a community adds \(A\) new members each month and loses a fraction \(c\) of its members each month, its size approaches a steady state where additions equal losses:
A paid community that gains 200 members a month and loses 8 % monthly levels off near 2,500 members, regardless of how hard the creator works on acquisition beyond that rate. To grow beyond the plateau, either additions must rise or churn must fall. Halving churn to 4 % doubles the steady state to 5,000. This simple model shows why retention deserves as much attention as acquisition, especially for memberships and newsletters.
Worked problem
When will growth plateau?
A newsletter has 3,000 subscribers, gains 400 new subscribers a month and loses 5 % of its list each month to unsubscribes and inactive addresses. What is its steady-state size? Approximately how big will it be after 12 months?
Show solution
- Steady state: \(N^* = 400 / 0.05 = 8{,}000\).
- The gap to the steady state shrinks by 5 % each month: \(N_n = N^* - (N^* - N_0)(1 - c)^n\).
- After 12 months: \(8{,}000 - 5{,}000 \times 0.95^{12} \approx 8{,}000 - 5{,}000 \times 0.54 = 5{,}300\).
Answer: The list approaches 8,000 subscribers and reaches about 5,300 after a year; reducing churn raises the ceiling.
Cohort analysis
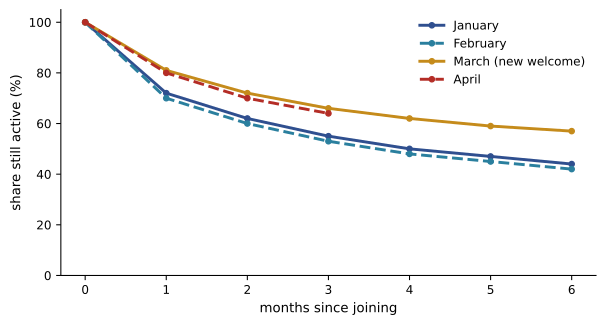
Overall numbers can hide what is happening. A cohort is a group of people who joined in the same period, such as everyone who subscribed in January. Tracking each cohort over time, what share remain active after one, three and six months, shows whether retention is improving and which acquisition sources bring loyal members. Members who joined through a collaboration might churn quickly, while those who arrived through search might stay for years. A cohort table lists cohorts in rows and months since joining in columns, with each cell showing the share still active. Comparing rows reveals whether changes such as a new onboarding sequence improved retention for later cohorts.
| Cohort | Month 0 | Month 1 | Month 3 | Month 6 |
|---|---|---|---|---|
| January | 100 % | 72 % | 55 % | 44 % |
| February | 100 % | 70 % | 53 % | 42 % |
| March (new welcome sequence) | 100 % | 81 % | 66 % | 57 % |
| April | 100 % | 80 % | 64 % | — |
Rented and owned growth
Followers on a platform are, in a sense, rented: the platform controls how often they see your work, can change rules or fees, and can suspend accounts. Email addresses, website visitors, community spaces you control and direct relationships are closer to owned, though even these depend on service providers. A resilient growth model uses rented platforms for discovery, where their recommendation engines are unmatched, and invites people into owned channels for retention (Lessons 6 and 7). The goal is not to abandon platforms but to avoid having your entire relationship with your audience held by one company.
North Star metrics and leading indicators
Because many numbers move at once, it helps to choose a "North Star" metric that best reflects the value your community receives, supported by leading indicators that predict it. For a newsletter, the North Star might be weekly engaged readers, people who open or click at least once a week; leading indicators might include sign-up rate and first-week engagement. For a community space, it might be weekly active members who post or react; leading indicators might include the share of new members who post in their first week. Choose metrics you can influence, review them consistently, and beware of optimizing a number in ways that damage the underlying value, such as using clickbait to raise opens (CRE-202 discussed Goodhart's law).
Growth stages and what changes
Creators often pass through recognizable growth stages, each with different priorities. In the early stage, with a few hundred followers, the main task is finding a format and audience that fit; growth is slow, and each new follower matters. Personal replies, collaborations with peers and consistent publishing matter most. In the traction stage, a format starts working and the platform begins recommending content to strangers; the priorities shift to consistency, retention and converting new viewers into subscribers and email sign-ups before attention moves on. In the scaling stage, growth is steady, and the challenges are capacity, delegation and keeping quality high while building owned channels and community spaces. In the mature stage, growth may slow as the creator approaches the natural size of their niche; the focus moves to retention, deepening relationships, new formats and diversified revenue. Knowing your stage helps you choose which metrics and strategies matter now, rather than copying advice meant for creators at a different point.
Leading and lagging indicators
Subscriber counts and revenue are lagging indicators: they show the results of past work, often weeks or months later. Leading indicators move first and predict future growth. For creators, leading indicators include click-through rate and audience retention on recent uploads, the share of views from non-subscribers, shares and saves, newsletter sign-up rates on new content, and the share of new community members who post in their first week. Watching leading indicators lets you adjust quickly: if retention on new videos is falling, you can change your approach before subscriber growth stalls. A good dashboard pairs one or two lagging indicators, such as monthly subscriber growth and email list size, with three or four leading indicators that you review weekly.
Seasonality and noise
Growth data is noisy. A single viral post can create a spike that distorts monthly comparisons, and many niches have seasonal patterns: fitness content rises in January, gardening in spring, tax and finance content near filing deadlines, and gift guides before the winter holidays. Compare periods with care, such as this January with last January rather than with December, and use rolling averages over several weeks to see underlying trends. When a spike occurs, look at what happens afterwards: if the baseline rises and stays higher, the spike brought lasting growth; if it returns to the previous level, the spike brought attention without retention.
Network effects in communities
Communities can show network effects: each new active member makes the community more valuable to others, because there are more people to answer questions, share work and form friendships. Network effects help explain why active communities can grow quickly through word of mouth once they pass a certain size, and why empty communities struggle to attract anyone. But network effects only work when new members are active and compatible with the community's purpose. Rapid growth from people who do not share the purpose can reduce value for everyone, as conversations become noisier and norms weaken. This is one reason community growth needs onboarding and moderation as much as promotion (Lessons 9 and 10).
Network effects also work in reverse. When active members leave, the community becomes less useful to those who remain, which can prompt further departures. Watching for early signs of decline, such as fewer replies to posts or key contributors going quiet, lets you intervene before a downward spiral sets in. Re-engaging long-time members personally, refreshing rituals and recruiting new contributors can restore momentum, and so can simply asking members what has changed for them and listening carefully to the answers.
Common mistakes
MistakePouring effort into the top of the funnel while a later step leaks.
InsteadFind and fix the weakest conversion first.
MistakeIgnoring churn.
InsteadModel the steady state and invest in retention.
MistakeExtrapolating a viral month.
InsteadPlan around steady, compounding growth.
MistakeJudging retention from totals only.
InsteadTrack cohorts over time.
MistakeHolding every relationship on one platform.
InsteadUse platforms for discovery and owned channels for retention.
Summary and key terms
- Funnels show where people drop off between stages.
- Flywheels show how satisfied members feed growth back.
- Growth loops are specific, repeatable mechanisms worth strengthening.
- Percentage growth compounds; the rule of 70 estimates doubling time.
- With constant additions and churn, size approaches A/c.
- Cohort analysis reveals retention changes hidden by totals.
- Use rented platforms for discovery and owned channels for retention.
- Funnel
- Stages from exposure to action with drop-off at each step.
- Conversion rate
- Share moving from one stage to the next.
- Flywheel
- Model where members accelerate growth.
- Growth loop
- Mechanism turning outputs into new inputs.
- Compounding
- Growth on growth over repeated periods.
- Rule of 70
- Doubling time approximated by 70 divided by the percentage rate.
- Churn
- Share of members lost per period.
- Steady state
- Size at which additions equal losses.
- Cohort
- Group of people who joined in the same period.
- North Star metric
- Single metric reflecting value delivered.
Practice problems
Work each problem on paper first, then reveal the answer to check.
Why fix the weakest funnel step first?
Show answer
Steps multiply, and weak steps are often cheapest to improve.
What does a flywheel add to the funnel idea?
Show answer
Members feed growth back into the system.
Give two examples of growth loops.
Show answer
Content, sharing, user-generated content, referral, collaboration loops.
Size of 20,000 after 12 months at 3 % monthly growth?
Show answer
About 28,500.
Doubling time at 7 % monthly growth?
Show answer
About 10 months.
Steady state with 150 joins and 6 % monthly churn?
Show answer
2,500.
How does halving churn affect the steady state?
Show answer
It doubles it.
What is a cohort?
Show answer
People who joined in the same period.
Why are platform followers called rented?
Show answer
The platform controls access and rules.
Give an example of a North Star metric for a newsletter.
Show answer
Weekly engaged readers.
Lesson quiz · 5 questions
Score 60% or more to complete this lesson.
Create a free account to save your progress, take quizzes and earn a certificate.