
CRE-101 · Lesson 10 of 12 · 31 min
Analytics and experiments
Every platform gives creators a dashboard full of numbers: views, impressions, click-through rates, retention graphs, traffic sources, demographics, revenue per thousand views. Used well, analytics show what the audience values and where content loses people, and turn guesswork into learning. Used badly, they become a source of anxiety, or lead creators to chase noise. Lesson 9 introduced experiments as part of a first-year plan. This lesson goes deeper: which metrics matter at each stage of the viewer journey, how to read retention graphs and traffic sources, how to judge whether a change really worked given the randomness in creator results, how to run simple experiments on titles, thumbnails and formats, and how to track the business metrics that matter for income.
A funnel of metrics
Analytics make most sense as a funnel that follows a viewer from first seeing a piece of content to becoming a fan or customer (Lesson 2):
| Stage | Question | Key metrics |
|---|---|---|
| Discovery | Is the content being shown? | impressions, reach, traffic sources |
| Click | Does the packaging persuade people to start? | click-through rate (CTR) |
| Watch | Does the content hold attention? | average view duration, average percentage viewed, retention graph, completion rate |
| Engage | Do people respond? | likes, comments, shares, saves, engagement rate |
| Return | Do people come back? | subscribers or follows gained, returning viewers, unique viewers |
| Convert | Do people take valuable actions? | link clicks, email sign-ups, members, sales, revenue per mille (RPM) |
Diagnosing a problem means finding where the funnel leaks. Low impressions suggest the platform is not testing the content widely, perhaps because of weak signals from the first viewers or a topic with little demand. Many impressions but low CTR point to packaging. Good CTR but low retention points to content that does not fulfil its promise or loses pace. Strong views with few follows suggest one-off interest rather than a channel people want more of.
Worked problem
Finding the leak
A creator's recent videos average 50,000 impressions, 3.1% CTR, 52% average percentage viewed on 9-minute videos, and 1.2 subscribers gained per 100 views. The channel's earlier, better-performing videos had 6% CTR and similar retention. Where should the creator focus?
Show solution
- Retention (52%) is healthy and unchanged.
- CTR has nearly halved from 6% to 3.1%, so far fewer people start the videos.
- Views: \(50{,}000 \times 0.031 = 1{,}550\) now, versus 3,000 at 6% for the same impressions.
Answer: The leak is at the click stage: titles and thumbnails, or topic choice, no longer persuade people. The creator should compare recent packaging with earlier successes and test new thumbnails and titles. Improving the content itself would not fix this problem.
Reading retention graphs
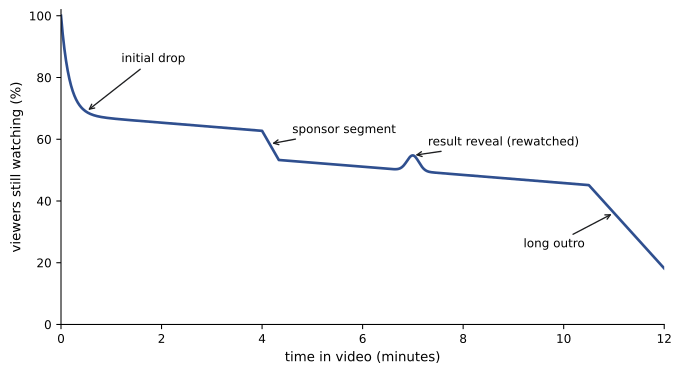
The retention graph, the share of viewers still watching at each moment, is the most informative chart available to a video creator. Patterns to look for:
- The initial drop: how many leave in the first 30 seconds. A steep drop means the hook does not match the packaging or is too slow (Lessons 2 and 6).
- Gradual decline: normal; a flatter line means a more engaging body.
- Sudden dips: specific moments where many viewers leave, such as a long sponsor segment, a tangent, a technical problem or an unclear explanation.
- Bumps: moments viewers rewatch or skip to, such as a key result, which suggest what the audience values most and could come earlier.
- The end: a large drop before the true end often signals a long outro; viewers leave when they sense the content is over.
Comparing a video's curve with the platform's benchmark for similar videos, and with the creator's own previous videos, shows whether a moment is unusually weak.
Traffic sources and audiences
Traffic source reports show where views come from: recommendations on the home page or feed, suggested videos, search, external sites, playlists, notifications to subscribers, and direct links. Each tells a different story. A video getting most views from search is likely evergreen and will keep earning; one driven by browse features depends on continued recommendation; external traffic shows sharing outside the platform. Audience reports show new versus returning viewers, demographics, geography, devices and when the audience is online. A channel where returning viewers make up a growing share is building loyalty; one dominated by new viewers who never return may be getting reach without relationship.
Noise, variation and small samples
Creator results are highly variable (Lesson 4): the same creator's similar videos can differ in views by ten times or more because of timing, competition, topic interest and the compounding of test waves. This variability makes it easy to see patterns that are not there. A thumbnail change followed by a rise in views may be coincidence; a "bad" week may be normal fluctuation. Practical safeguards:
- Compare averages over several pieces, not single results, and look at medians, which are less affected by one viral hit.
- Compare like with like: similar topics, lengths and times since publication (for example views in the first 7 days).
- Use rates (CTR, retention, conversion) rather than raw totals where possible, since rates depend less on how widely a piece was shown.
- Be wary of explaining every rise and fall; focus on persistent trends over months.
Worked problem
Median versus mean
A creator's last nine videos earned 2,100, 1,800, 2,600, 2,400, 45,000, 1,900, 2,200, 2,000 and 2,300 views in their first week. What are the mean and median, and which better describes a typical video?
Show solution
- Sum: \(2{,}100 + 1{,}800 + 2{,}600 + 2{,}400 + 45{,}000 + 1{,}900 + 2{,}200 + 2{,}000 + 2{,}300 = 62{,}300\); mean \(= 6{,}922\).
- Sorted: 1,800, 1,900, 2,000, 2,100, 2,200, 2,300, 2,400, 2,600, 45,000; median \(= 2{,}200\).
Answer: The median of 2,200 describes a typical video; the mean of about 6,900 is inflated by one viral hit. Planning, and judging whether a new video "did well", should use the median, while studying the hit separately to see whether its success can be repeated.
Running experiments
An experiment changes one thing deliberately and measures the effect against a comparison. Creators can experiment with packaging, hooks, length, formats, topics, posting schedules and calls to action. Good experiment practice:
- State a hypothesis in advance: "Opening with the finished result will raise 30-second retention from 65% to 75%."
- Change one variable at a time, keeping others as similar as possible.
- Decide the metric and how long to measure before looking at results.
- Run the test over several pieces, or use built-in testing tools, to reduce noise.
- Record results in a simple log, including failures, so that lessons accumulate.
Some platforms offer split tests: YouTube's "Test and compare" feature shows different thumbnails (and in some cases titles) to different viewers and picks the one with the most watch time, and several platforms allow testing of posts or ads with separate audiences. These randomized tests are much more reliable than before-and-after comparisons, because both versions face the same conditions at the same time.
Is the difference real?
With a randomized test, a simple statistical check shows whether a difference is larger than chance would produce. For two click-through rates \(p_1\) and \(p_2\) from \(n_1\) and \(n_2\) impressions, with pooled rate \(\bar p\), the z statistic is
and a value of \(|z|\) above about 2 suggests the difference is unlikely to be due to chance alone (roughly 95% confidence).
Worked problem
A thumbnail test
Thumbnail A gets 900 clicks from 20,000 impressions (4.5%); thumbnail B gets 1,060 clicks from 20,000 impressions (5.3%). Is B's advantage likely real? What if the test had only 2,000 impressions each, with 90 and 106 clicks?
Show solution
- Pooled rate: \((900 + 1{,}060)/40{,}000 = 0.049\).
- Standard error: \(\sqrt{0.049 \times 0.951 \times (2/20{,}000)} = 0.00216\); \(z = 0.008/0.00216 = 3.7\).
- With 2,000 impressions each: standard error \(\sqrt{0.049 \times 0.951 \times (2/2{,}000)} = 0.00683\); \(z = 0.008/0.00683 = 1.2\).
Answer: With 20,000 impressions each, z = 3.7, so B's higher CTR is very likely real. With 2,000 each, the same rates give z = 1.2, which could easily be chance. Small samples cannot reliably detect differences of this size, which is why creators should not declare winners after a few hundred impressions.
Business metrics
For creators who earn money, a few business metrics connect content to income (Lesson 5):
- RPM (revenue per mille): total revenue per 1,000 views, after the platform's share; it differs from the advertiser-facing CPM.
- Revenue per piece and per hour of work: helps decide which formats and projects are worth the effort.
- Conversion rates: of viewers to email subscribers, of subscribers to customers or members.
- Churn: the share of members or subscribers who cancel each month; reducing churn is often easier than finding new members.
- Customer lifetime value: average revenue per customer over the relationship, which shows how much can be spent to acquire one.
Worked problem
Membership economics
A creator has 400 members paying $5 a month, with 6% cancelling each month. On average, how long does a member stay, what is the lifetime value, and how many new members are needed each month to keep membership stable?
Show solution
- Average membership length: \(1/0.06 = 16.7\) months.
- Lifetime value: \(5 \times 16.7 = \$83\) (before platform fees).
- New members needed: \(400 \times 0.06 = 24\) per month to replace cancellations.
Answer: Members stay about 17 months on average and are worth about $83 each. The creator needs 24 new members a month just to stay level; cutting churn to 4% would extend average membership to 25 months and raise lifetime value to $125, often a better investment than chasing new sign-ups.
Using analytics without being used by them
Constant checking of real-time numbers is a recognized source of stress for creators (Lesson 7) and rarely improves decisions. Healthier habits include reviewing analytics at set times (for example 48 hours and 7 days after publishing, and a monthly overview), focusing on a few metrics tied to current goals, keeping notes on what was learned rather than just numbers, and remembering that metrics are proxies: a video that helps a small number of people a great deal may matter more than one that performs well briefly. Qualitative feedback, the comments and messages that explain why people watch, complements the numbers.
A worked diagnosis
Suppose a creator notices that a new series of videos is getting fewer views than her usual uploads. Rather than guessing, she works down the funnel. Impressions are similar to her other videos, so the platform is still showing them. Click-through rate is 3.1 percent against her usual 5 percent, so fewer people choose to watch. Average percentage viewed is slightly higher than usual, so the people who do click are satisfied. The problem is the packaging, not the content: titles and thumbnails for the new series are not telling browsers what they will get.
She writes two new thumbnail and title options for each of the next three videos and uses the platform's built-in testing tool where available. One option names the specific problem the video solves; the other uses a bold image with few words. The problem-focused option wins on two of three videos, though only one difference is large enough to be confident about at the sample sizes involved. She adopts the problem-focused style, keeps watching click-through rate and records the decision in her experiment log so she can review it later. The whole process took a few hours and replaced a vague worry with a specific, testable fix.
Common mistakes
MistakeJudging success by raw view counts alone.
InsteadDiagnose with the funnel: impressions, CTR, retention, engagement, returns and conversions.
MistakeReacting to single results.
InsteadCompare medians over several similar pieces and look for persistent trends.
MistakeChanging several things at once and guessing which worked.
InsteadChange one variable, state a hypothesis and measure a chosen metric.
MistakeDeclaring an A/B winner after a few hundred impressions.
InsteadUse enough data and check whether the difference exceeds chance.
MistakeWatching real-time analytics constantly.
InsteadReview at set intervals and focus on learning.
Summary and key terms
- Analytics follow a funnel from discovery through click, watch, engagement and return to conversion; find where it leaks.
- Retention graphs reveal weak hooks, dips, valued moments and long outros.
- Traffic sources and returning-viewer data show how content is found and whether loyalty is growing.
- Creator results are noisy; use medians, comparable windows and rates, and focus on trends.
- Experiments change one variable with a hypothesis; randomized split tests are most reliable.
- A z test shows whether a difference in rates is larger than chance; small samples are unreliable.
- RPM, revenue per hour, conversion, churn and lifetime value connect content to income.
- Impressions
- The number of times content was shown to users.
- Click-through rate
- The share of impressions that led to views.
- Average view duration
- The average time viewers spent watching.
- Retention graph
- A chart of the share of viewers remaining over time.
- Traffic source
- Where views come from, such as search or recommendations.
- Median
- The middle value of a sorted set, robust to outliers.
- Hypothesis
- A specific, testable prediction about the effect of a change.
- Split test
- A randomized comparison of two versions shown to different viewers.
- RPM
- Revenue per 1,000 views received by the creator.
- Churn
- The share of subscribers or members who cancel in a period.
Practice problems
Work each problem on paper first, then reveal the answer to check.
Views from 80,000 impressions at 4% CTR?
Show answer
3,200.
High CTR but low retention suggests what problem?
Show answer
Content that does not fulfil the packaging's promise.
What does a sudden dip in a retention graph indicate?
Show answer
A specific moment where many viewers left.
Why are search-driven views valuable?
Show answer
They tend to continue for a long time.
Median of 3,000, 2,500, 40,000, 2,800 and 3,200?
Show answer
3,000.
Why change only one variable in an experiment?
Show answer
So the effect can be attributed to that change.
What z value suggests a difference is unlikely to be chance?
Show answer
Above about 2 in absolute value.
Revenue from 250,000 views at a $4 RPM?
Show answer
$1,000.
Average membership length with 5% monthly churn?
Show answer
20 months.
Name a healthy analytics habit.
Show answer
Review at set intervals and focus on a few goal-related metrics.
Lesson quiz · 5 questions
Score 60% or more to complete this lesson.
Create a free account to save your progress, take quizzes and earn a certificate.