
CON-420 · Lesson 7 of 12 · 27 min
Disruption and productivity claims
A delay claim asks for the cost of the project taking longer. A disruption claim asks for the cost of the work becoming less efficient. The two often travel together, but they are different. A crew can be disrupted without the project finishing late: if the tile installers on Ashford have to work around other trades in a crowded natatorium, they install fewer square metres per hour, the tiling costs more, and yet the critical path may be unaffected. Conversely, a project can be delayed without any crew becoming less productive, if work simply stops and restarts.
Disruption is the hardest kind of claim to prove. Lost productivity is invisible on any single day; it shows up only when actual hours are compared with what the hours should have been. And there are always several possible causes, some of them the contractor's own. This lesson explains the causes of lost productivity, the hierarchy of methods for measuring it, the measured mile in detail, and the weaker methods that are used when better evidence is not available. Lesson 8 covers total cost methods, which are the last resort.
What disrupts productivity
Productivity is output per unit of input, usually installed quantity per labour hour. A crew's productivity depends on the conditions in which it works, and many owner actions can change those conditions.
| Cause | How it reduces productivity | Ashford example |
|---|---|---|
| Trade stacking | Too many trades in one area interfere with each other and share access, hoists and lay-down space | Tile, mechanical and electrical crews all in the natatorium after the late tile approval compressed the sequence |
| Out-of-sequence work | Work done in a different order from the plan needs extra handling, protection and return trips | Change room tile installed before plumbing rough-in was finished, then partly removed |
| Changes and rework | Stopping to rework installed work, plus the learning curve on the new design | Pool deck slope revised after tile layout was approved |
| Overtime and shift work | Fatigue and reduced supervision on long hours | Six 10-hour days to recover lost time |
| Crew size beyond the optimum | Extra workers in a limited area reduce output per worker | Tile crew increased from 8 to 14 in the same space |
| Stop-and-start | Demobilizing and remobilizing, losing the learning curve | Tilers sent away for two weeks during the deck redesign |
| Weather or season shift | Work pushed into winter needs heat, hoarding and slower methods | Envelope work pushed into December by the truss delay |
| Information delays | Crews waiting for answers to RFIs or working on assumptions | Tile layout questions unanswered for two weeks |
Several causes usually act at once, and some are the contractor's responsibility: poor supervision, under-skilled workers, late material deliveries it arranged, its own scheduling errors. A credible disruption claim separates the owner-caused loss from the rest. If it cannot, it is likely to fail.
The ripple effect of many changes, sometimes called cumulative impact, is the most contested form. The argument is that each change was priced and paid individually, but together they disrupted the project in a way no single change order captured. Owners respond that the contractor accepted each change order, often with language saying the price covered all direct and indirect costs, and so has given up any further claim. Whether a cumulative impact claim survives depends heavily on the wording of the change orders, the reservation of rights the contractor made when signing them, and the evidence. Lesson 2 discussed reservation language; this is where it pays off.
The hierarchy of methods
Industry guidance, including AACE International's recommended practice on estimating lost labour productivity (25R-03) and the Society of Construction Law Delay and Disruption Protocol (2nd edition, 2017), ranks methods by how directly they rely on project records. The more a method relies on the project's own data and isolates the owner-caused cause, the more persuasive it is.
| Method | Basis | Strength |
|---|---|---|
| Measured mile | Compares productivity on the same project in an unimpacted period with the impacted period | Strongest: uses the project's own records and the same crew, work and conditions |
| Baseline productivity | Uses the best sustained productivity achieved on the project as the benchmark when no clean unimpacted period exists | Strong, but the benchmark may be optimistic |
| Comparison with similar work or projects | Compares with the contractor's productivity on similar work elsewhere | Moderate: differences between projects must be explained |
| Earned value analysis | Compares earned hours (budget hours for work completed) with actual hours over time | Moderate: depends on the reliability of the original estimate |
| Industry studies and factors | Applies published percentage losses for conditions such as overtime or congestion | Weak: generic, not tied to the project |
| Modified total cost | Actual cost minus bid, adjusted for contractor problems and bid errors | Weakest acceptable method, used when nothing else works (lesson 8) |
| Total cost | Actual cost minus bid | Generally rejected unless strict conditions are met (lesson 8) |
The measured mile
The measured mile compares the productivity of the same work on the same project in a period that was not affected by the disruption with the productivity in the period that was. Because the crew, the work, the site and the contractor's management are the same, the main difference between the periods is the disruption. The method has been accepted by courts and boards in Canada and the US and is generally the preferred approach where the records support it.
To use it, the contractor needs reliable records of installed quantities and labour hours by activity and period. That means cost codes that separate the activity, foremen's reports of quantities installed each day or week, and payroll hours charged to the right codes. A contractor that records only total hours for the whole trade cannot do a measured mile. This is one of the main reasons lesson 12 emphasizes daily records.
import random
random.seed(420)
# Weekly tiling records on Ashford: (week, impacted?, installed m2, crew hours)
weeks = []
for w in range(1, 19):
    impacted = 7 <= w <= 15          # weeks of trade stacking after the late tile approval and pool changes
    rate = random.gauss(1.05 if impacted else 1.42, 0.06)
    hours = random.choice([280, 320, 360])
    weeks.append((w, impacted, round(rate * hours), hours))
un = [(q, h) for w, i, q, h in weeks if not i]
im = [(q, h) for w, i, q, h in weeks if i]
r_un = sum(q for q, h in un) / sum(h for q, h in un)
r_im = sum(q for q, h in im) / sum(h for q, h in im)
q_im = sum(q for q, h in im); h_im = sum(h for q, h in im)
earned = q_im / r_un
lost = h_im - earned
print(f"Unimpacted rate: {r_un:.2f} m2/h over {len(un)} weeks")
print(f"Impacted rate:   {r_im:.2f} m2/h over {len(im)} weeks")
print(f"Impacted work: {q_im:,} m2 in {h_im:,} h; should have taken {earned:,.0f} h")
print(f"Lost hours: {lost:,.0f} ({lost / h_im:.0%} of impacted hours); at $68/h = ${lost * 68:,.0f}")
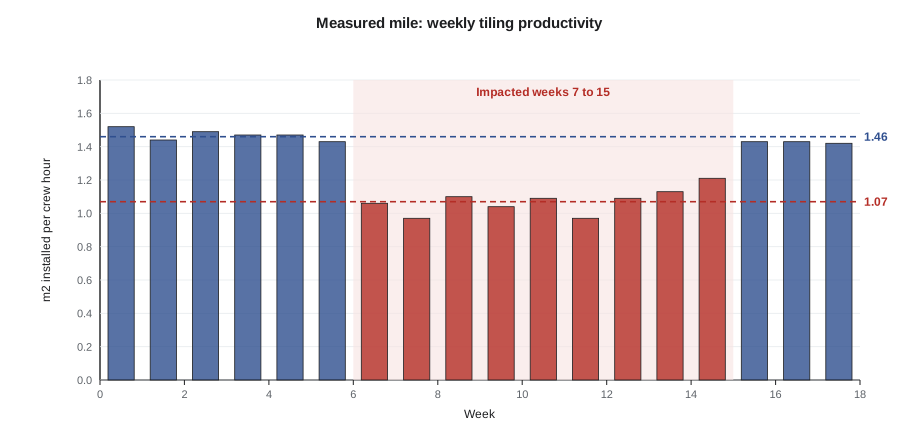
print("Weekly rates:", " ".join(f"{q/h:.2f}{'*' if i else ''}" for w, i, q, h in weeks))Unimpacted rate: 1.46 m2/h over 9 weeks Impacted rate: 1.07 m2/h over 9 weeks Impacted work: 3,040 m2 in 2,840 h; should have taken 2,088 h Lost hours: 752 (26% of impacted hours); at $68/h = $51,142 Weekly rates: 1.52 1.44 1.49 1.47 1.47 1.43 1.06* 0.97* 1.10* 1.04* 1.09* 0.97* 1.09* 1.13* 1.21* 1.43 1.43 1.42
The tiling crew achieved about 1.46 m² per hour in the unimpacted weeks before and after the disruption and about 1.07 m² per hour during it. The 3,040 m² installed in the impacted weeks should have taken about 2,088 hours at the unimpacted rate; it took 2,840. The difference of about 752 hours, roughly a quarter of the impacted hours, is the measured loss. At an illustrative burdened rate of $68 per hour, the loss is about $51,000 before markup.
The calculation is simple; the arguments are about whether the comparison is fair.
| Challenge | What the owner argues | How the contractor responds |
|---|---|---|
| Different work | The unimpacted weeks were large open deck areas; the impacted weeks were small change rooms with many cuts | Split by area type and compare like with like, or adjust for complexity |
| Learning curve | Early weeks were slower because the crew was learning; later weeks were faster for that reason | Use a mature unimpacted period, or one at each end as here |
| Contractor causes in the impacted period | The crew changed foremen in week 9 and lost two experienced tilers | Show records; if true, allocate part of the loss to the contractor |
| Cherry-picking | The contractor chose the best weeks as unimpacted | Use all unimpacted weeks, and show the sensitivity to the choice |
| Causation | The loss is real but the contractor has not tied it to the owner's actions | Link the impacted period to specific events with dates, photos and daily reports |
A sensitivity check strengthens the analysis. If using only the weeks before the disruption, or only the weeks after, or excluding the best and worst weeks changes the loss by a few per cent, the result is robust. If it swings widely, the reviewer will notice, and the contractor should explain why.
When there is no clean measured mile
Sometimes the whole of an activity was impacted, or the records do not separate the activity. Then the contractor must use a weaker method and accept that it will carry less weight.
- Baseline productivity: Use the best sustained productivity achieved on the project, for example the best five consecutive weeks, as the benchmark even if those weeks were partly impacted. It tends to favour the contractor and needs careful explanation.
- Comparable projects: Compare with the same contractor's productivity on similar work on other projects, adjusted for known differences. The owner will ask for the full records of those projects.
- Earned value: Compare earned hours with actual hours, period by period, and identify where the gap opened. This shows when productivity fell, which helps with causation, but the loss is measured against the estimate, so a low estimate inflates it.
- Industry factors: Apply published loss percentages for conditions such as overtime, crew density, stacking and season. They are generic and are often criticized, but they can support or cross-check a project-based method.
Industry factor tables, such as those published by the Mechanical Contractors Association of America and the National Electrical Contractors Association, list conditions with minor, average and severe loss percentages. They were developed as estimating aids and their use to prove damages has been criticized because they are not based on the specific project and their research basis is limited. Courts and boards in both countries have accepted them in some cases and rejected them in others, often depending on whether the claimant also showed project-specific evidence. Studies of extended overtime, such as those by the Business Roundtable and later researchers, show productivity falling as weekly hours rise and the overtime continues for weeks, but the figures vary between studies.
# Illustrative factor-based cross-check for the Ashford tiling impacted period
# Percentages are placeholders in the style of published factor tables, not values from any table.
impacted_hours = 2_840
factors = {
    "Trade stacking (average)":       0.10,
    "Crew size above optimum (minor)": 0.05,
    "Out-of-sequence work (minor)":    0.05,
    "Extended overtime (minor)":       0.05,
}
combined = 1.0
for name, f in factors.items():
    combined *= (1 - f)
loss_share = 1 - combined
print(f"Combined loss share: {loss_share:.1%}")
print(f"Factor-based lost hours: {impacted_hours * loss_share:,.0f} (measured mile gave about 752)")Combined loss share: 22.8% Factor-based lost hours: 649 (measured mile gave about 752)
Combining the factors multiplicatively, rather than adding them, avoids overstating the loss when several conditions act at once. Here the factor method gives about 650 lost hours, somewhat lower than the measured mile's 752. That agreement is useful as a cross-check, but the measured mile, based on the project's own records, would carry the weight.
Causation and allocation
Measuring a productivity loss is half the job; the other half is showing that the owner caused it. The best evidence ties the impacted period to specific owner events: the date the late tile approval arrived, the date the deck redesign was issued, the period when the tile, mechanical and electrical crews were all in the natatorium. Daily reports that record crew sizes, areas worked and interference, photographs of congestion and correspondence complaining about it at the time are far more persuasive than an expert's reconstruction after the fact.
Where the contractor contributed to the loss, an honest claim allocates. If the tile crew's foreman changed in week 9 and the next two weeks were the worst in the impacted period, the contractor might accept responsibility for part of the loss in those weeks. Reviewers and tribunals tend to trust a claim that concedes what it should, and to discount everything in a claim that concedes nothing.
Canadian courts generally require the claimant to prove that the owner's breach caused the loss and to quantify it with reasonable precision, though they recognize that disruption cannot always be measured exactly and may award a reasonable estimate where the fact of loss is proved. The contract may also limit recovery: CCDC 2 changes priced under GC 6.3 may be argued to include the associated disruption unless the contractor reserved its rights, and many supplementary conditions add language saying change order prices include all impacts.
Worked problem
Measured mile with an allocation
Using the Ashford measured mile, Kestrel Ridge accepts that its foreman change caused part of the loss in weeks 9 and 10. Those weeks account for 140 of the 752 lost hours, and Kestrel Ridge accepts half of that. Price the owner-caused loss at $68 per hour with a 10 % markup allowed on disruption costs.
Show solution
- Measured loss: 752 hours.
- Contractor share: 140 × 0.5 = 70 hours.
- Owner-caused loss: 752 − 70 = 682 hours.
- Cost: 682 × $68 = $46,376.
- With 10 % markup: $46,376 × 1.10 = $51,014.
Answer: The owner-caused disruption claim for the tiling is about $51,000. Conceding 70 hours costs Kestrel Ridge about $5,000 but makes the remaining figure much harder to attack.
Common mistakes
MistakeClaiming disruption with only total hours for the trade.
InsteadCode hours and quantities by activity and period so a measured mile is possible.
MistakeChoosing the best weeks as the unimpacted period.
InsteadUse all genuinely unimpacted weeks and show the sensitivity of the result.
MistakeAdding industry factors together.
InsteadCombine factors multiplicatively and use them as a cross-check, not the main proof.
MistakeSigning change orders that say the price includes all impacts, then claiming cumulative impact.
InsteadReserve rights for cumulative impact when signing, with specific language.
MistakeBlaming the owner for every lost hour.
InsteadIdentify contractor causes and allocate; concessions build credibility.
Summary and key terms
- Disruption is lost productivity; it can occur with or without delay to completion.
- Causes include trade stacking, out-of-sequence work, changes, overtime, crew overloading, stop-and-start and information delays.
- Methods rank from measured mile, through baseline, comparisons and earned value, to industry factors and total cost.
- The measured mile compares unimpacted and impacted productivity on the same work and project, and is generally the preferred method.
- It requires quantities and hours recorded by activity and period.
- Industry factors are generic and best used as a cross-check; combine them multiplicatively.
- Causation and honest allocation of contractor-caused losses are as important as the measurement.
- Disruption
- A loss of productivity caused by changed working conditions, whether or not completion is delayed.
- Productivity
- Output per unit of input, usually installed quantity per labour hour.
- Trade stacking
- Too many trades working in the same area at the same time.
- Cumulative impact
- The combined disruption caused by many changes, beyond what individual change orders priced.
- Measured mile
- A comparison of productivity in unimpacted and impacted periods of the same work on the same project.
- Baseline productivity
- The best sustained productivity achieved on a project, used as a benchmark when no clean unimpacted period exists.
- Earned hours
- The budgeted hours for the work actually completed.
- Industry factors
- Published percentage productivity losses for conditions such as overtime or congestion.
- Reservation of rights
- Language preserving a claim for further costs when signing a change order.
Practice problems
Work each problem on paper first, then reveal the answer to check.
A crew installs 2,000 m² in 1,600 hours in an impacted period; the unimpacted rate was 1.6 m² per hour. How many hours were lost?
Show answer
1,600 − 2,000 ÷ 1.6 = 350 hours.
Why is the measured mile generally preferred?
Show answer
It uses the same project, crew and work, so the main difference is the disruption.
What records does a measured mile need?
Show answer
Installed quantities and labour hours by activity and period.
Two factors of 10 % and 5 % apply. What is the combined loss share?
Show answer
1 − 0.90 × 0.95 = 14.5 %.
Why combine factors multiplicatively?
Show answer
Adding them overstates the loss when conditions act together.
What is cumulative impact?
Show answer
The combined disruption from many changes beyond individual change order prices.
How does an owner usually defend against cumulative impact?
Show answer
By pointing to change orders accepted without reservation as full compensation.
Name two challenges to a measured mile.
Show answer
Different work in the periods, learning curve, contractor causes, cherry-picking or causation.
What does earned value show that helps with causation?
Show answer
When the gap between earned and actual hours opened.
Why concede part of a productivity loss?
Show answer
It builds credibility and makes the remaining claim harder to attack.
Lesson quiz · 5 questions
Score 60% or more to complete this lesson.
Create a free account to save your progress, take quizzes and earn a certificate.