
CMPUT-367 · Lesson 8 of 12 · 33 min
Probabilistic classifiers: naive Bayes and discriminant analysis
There are two ways to build a probabilistic classifier. A discriminative model, such as logistic regression, models \(P(y \mid \mathbf{x})\) directly: it learns a boundary between classes and never asks how the inputs themselves are distributed. A generative model learns how each class produces its inputs, a class-conditional density \(p(\mathbf{x} \mid y)\), together with the class prior \(P(y)\), and then classifies with Bayes' rule:
The denominator is the same for every class, so the predicted class is \(\arg\max_k p(\mathbf{x} \mid y = k) P(y = k)\). Generative classifiers can do things discriminative ones cannot: generate synthetic examples, detect inputs unlike anything seen in training (low \(p(\mathbf{x})\)), handle missing features by marginalizing them out, and incorporate prior knowledge about how data are produced. They also tend to learn from fewer examples. Their weakness is that modelling the whole input distribution is harder than modelling a boundary, and errors in that model become errors in classification.
This lesson develops the two most important generative classifiers: naive Bayes, which assumes features are conditionally independent given the class, and Gaussian discriminant analysis, which assumes each class is a multivariate Gaussian. CMPUT-366's lesson on Bayesian networks provides the probabilistic background: naive Bayes is the simplest Bayesian network, a class node with an arrow to every feature. AI-320 develops richer generative models.
The naive Bayes assumption
With d binary features, the class-conditional distribution \(p(\mathbf{x} \mid y)\) has \(2^d - 1\) free parameters per class, far too many to estimate from data. Naive Bayes makes a drastic simplifying assumption: given the class, the features are independent, so
and the parameters number only d per class. The assumption is almost always false. In a spam filter, the words free and prize are not independent given that a message is spam. Yet naive Bayes often classifies well, for a reason Pedro Domingos and Michael Pazzani analysed in 1997: classification needs only the correct ordering of the class posteriors, not accurate values, and the errors introduced by the independence assumption often push all classes in similar directions. Its probability estimates, however, are typically far too extreme, because correlated features are counted as independent pieces of evidence; if they matter, they must be recalibrated (lesson 9).
Naive Bayes for text
Naive Bayes has a long history in text classification, from Maron's 1961 work on automatic indexing to the spam filters popularized by Paul Graham's 2002 essay A Plan for Spam. The multinomial model treats a document as a bag of words: it ignores word order and models the word counts. The probability of word w in class k is estimated as its share of all words in class k's training documents. A word that never appears in a class's training documents would get probability zero and veto that class for any document containing it, however strong the other evidence. Laplace (add-one) smoothing prevents this by adding a pseudo-count \(\alpha\) to every word:
where \(\lvert V \rvert\) is the vocabulary size. Smoothing is the maximum a posteriori estimate under a Dirichlet prior, and \(\alpha\) is a regularization hyperparameter like the \(\lambda\) of ridge regression. Multiplying hundreds of small probabilities underflows floating-point arithmetic, so implementations add log probabilities instead, and convert back with the log-sum-exp trick only when a probability is needed.
# Multinomial naive Bayes from scratch on a tiny invented set of messages.
import math
from collections import Counter
train = [("win a free prize now", "spam"), ("free money claim your prize", "spam"),
         ("limited offer win cash now", "spam"), ("claim free cash offer", "spam"),
         ("meeting moved to tuesday", "ham"), ("can you send the lab report", "ham"),
         ("lunch on tuesday with the team", "ham"), ("report due friday please review", "ham"),
         ("free pizza at the team meeting", "ham")]
classes = ["spam", "ham"]
vocab = sorted({w for text, _ in train for w in text.split()})
counts = {c: Counter() for c in classes}; docs = Counter()
for text, c in train:
    counts[c].update(text.split()); docs[c] += 1

def log_posterior(text, alpha=1.0):
    scores = {}
    for c in classes:
        total = sum(counts[c].values())
        s = math.log(docs[c] / len(train))                   # log prior
        for w in text.split():
            if w in vocab:                                   # ignore words never seen in training
                s += math.log((counts[c][w] + alpha) / (total + alpha * len(vocab)))
        scores[c] = s
    return scores

for msg in ["claim your free prize", "team meeting on friday", "free lunch with the team"]:
    s = log_posterior(msg)
    z = max(s.values()); p_spam = math.exp(s["spam"] - z) / sum(math.exp(v - z) for v in s.values())
    print(f"{msg!r:28} -> {max(s, key=s.get):4}  P(spam) = {p_spam:.3f}")
print(f"vocabulary size {len(vocab)}; P(word='free' | spam) = {(counts['spam']['free'] + 1) / (sum(counts['spam'].values()) + len(vocab)):.3f}")'claim your free prize' -> spam P(spam) = 0.981 'team meeting on friday' -> ham P(spam) = 0.039 'free lunch with the team' -> ham P(spam) = 0.065 vocabulary size 31; P(word='free' | spam) = 0.080
Even with nine training messages, the classifier makes sensible decisions, and the third message shows the bag-of-words model weighing evidence: free points toward spam, but team and lunch point toward ham. Note the code skips words never seen in training, a common convention; smoothing handles words seen in one class but not the other. Real spam filters train on millions of messages, add features beyond words (sender reputation, links, formatting) and increasingly use discriminative models, but naive Bayes remains a strong and extremely fast baseline for text, especially with little labelled data.
Other naive Bayes variants suit other feature types. Bernoulli naive Bayes models the presence or absence of each vocabulary word, including the absence of words, which helps for short texts. Gaussian naive Bayes models each continuous feature within each class as a univariate normal distribution with its own mean and variance. All share the independence assumption and the same training procedure: count, or compute means and variances, separately for each class. Training is a single pass over the data, which makes naive Bayes one of the fastest learners there is.
Gaussian discriminant analysis
For continuous features, a natural generative model is a multivariate Gaussian for each class: \(p(\mathbf{x} \mid y = k) = \mathcal{N}(\boldsymbol{\mu}_k, \Sigma_k)\). Maximum likelihood estimates are the class means, the class covariance matrices and the class frequencies. The log posterior of class k, up to a constant, is the quadratic discriminant function
and the classifier picks the class with the largest \(\delta_k\). Because \(\delta_k\) is quadratic in x, the boundaries between classes are quadratic curves (conic sections in two dimensions); this is quadratic discriminant analysis (QDA). If all classes are assumed to share one covariance matrix \(\Sigma\), the quadratic terms cancel when two classes are compared, and the boundaries are linear: this is linear discriminant analysis (LDA), which Ronald Fisher introduced in 1936 to separate species of iris from four flower measurements.
The choice between them is a bias–variance trade-off. QDA estimates a full covariance matrix per class, about \(d^2/2\) parameters each, and needs many examples per class when d is large; LDA pools the covariance and needs far fewer. Regularized discriminant analysis shrinks each class covariance toward the pooled one, interpolating between them. Gaussian naive Bayes is the special case with diagonal covariance matrices, which ignores correlations entirely. LDA also has a geometric reading useful in its own right: it projects the data onto the directions that best separate the class means relative to the within-class spread, which provides supervised dimensionality reduction to at most K − 1 dimensions.
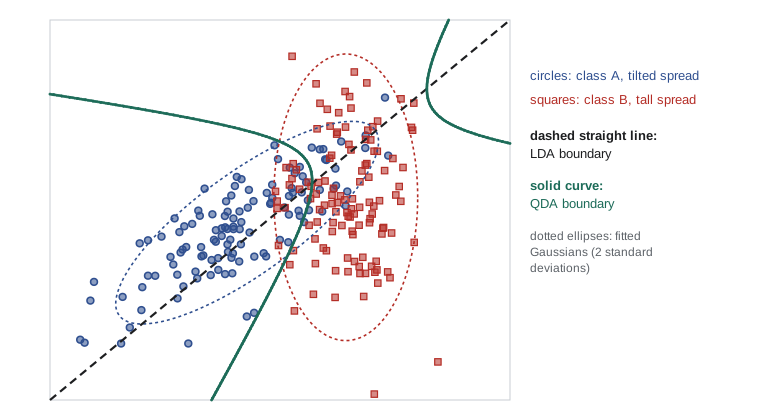
# Gaussian naive Bayes, LDA, QDA and logistic regression on data with unequal class covariances.
import numpy as np
from sklearn.naive_bayes import GaussianNB
from sklearn.discriminant_analysis import LinearDiscriminantAnalysis, QuadraticDiscriminantAnalysis
from sklearn.linear_model import LogisticRegression
rng = np.random.default_rng(367)
def make(n):
    a = rng.multivariate_normal([0, 0], [[1.0, 0.8], [0.8, 1.0]], n)      # correlated features
    b = rng.multivariate_normal([1.5, 0.5], [[0.3, 0.0], [0.0, 2.0]], n)  # a different shape
    return np.vstack([a, b]), np.r_[np.zeros(n), np.ones(n)]
Xtr, ytr = make(150); Xte, yte = make(5000)
for name, m in [("Gaussian naive Bayes", GaussianNB()), ("LDA (shared covariance)", LinearDiscriminantAnalysis()),
                ("QDA (separate covariances)", QuadraticDiscriminantAnalysis()),
                ("logistic regression", LogisticRegression())]:
    m.fit(Xtr, ytr)
print(f"{name:27} test error {1 - m.score(Xte, yte):.3f}")Gaussian naive Bayes test error 0.150 LDA (shared covariance) test error 0.153 QDA (separate covariances) test error 0.131 logistic regression test error 0.154
In this invented problem the two classes have very different covariance structures, so the true Bayes boundary is curved and QDA, whose assumptions match, wins clearly. LDA and logistic regression are both linear and perform similarly. Gaussian naive Bayes models each class with an axis-aligned ellipse; it can still draw a curved boundary, but it cannot represent the tilt of the first class, and it lands between the linear methods and QDA.
Generative versus discriminative
LDA and logistic regression produce the same form of classifier: a linear boundary, and posterior log odds that are linear in x. Indeed, if the LDA assumptions hold, the posterior is exactly a logistic function. The difference lies in how the weights are estimated. LDA fits the full joint distribution of x and y; logistic regression fits only the conditional distribution of y given x. When the Gaussian assumptions are true, LDA is more efficient, needing fewer examples for the same accuracy. When they are false, logistic regression is more robust, because it makes no claim about how x is distributed.
Andrew Ng and Michael Jordan made this trade-off precise in a 2002 paper comparing naive Bayes with logistic regression. The generative classifier approaches its (higher) asymptotic error quickly, needing a number of examples logarithmic in the number of features, while the discriminative classifier approaches its (lower) asymptotic error more slowly, needing a number linear in the features. So with little data, naive Bayes often wins; with plenty, logistic regression catches up and passes it. The program below reproduces the effect on invented binary data with 50 features, two of which are copied twice more, so that naive Bayes counts their evidence three times over: a sharp violation of the independence assumption.
# Generative versus discriminative: naive Bayes and logistic regression as training data grow.
import numpy as np
from sklearn.naive_bayes import BernoulliNB
from sklearn.linear_model import LogisticRegression
rng = np.random.default_rng(1)
d = 50
p1 = rng.uniform(0.2, 0.8, d); p0 = np.clip(p1 + rng.normal(0, 0.15, d), 0.05, 0.95)
p0[:2] = np.clip(p1[:2] + 0.2, 0.05, 0.95)
def make(n):
    y = rng.integers(0, 2, n)
    X = (rng.uniform(size=(n, d)) < np.where(y[:, None] == 1, p1, p0)).astype(int)
    return np.hstack([X, X[:, :2], X[:, :2]]), y     # two features appear three times each
Xte, yte = make(20000)
print("    n   naive Bayes error   logistic regression error")
for n in (10, 30, 100, 1000, 5000):
    e_nb, e_lr = [], []
    for rep in range(20):
        X, y = make(n)
        if len(set(y)) < 2: continue                   # need both classes to fit
        e_nb.append(1 - BernoulliNB().fit(X, y).score(Xte, yte))
        e_lr.append(1 - LogisticRegression(C=1.0, max_iter=2000).fit(X, y).score(Xte, yte))
print(f"{n:5} {np.mean(e_nb):17.3f} {np.mean(e_lr):25.3f}")n naive Bayes error logistic regression error 10 0.362 0.416 30 0.265 0.287 100 0.205 0.230 1000 0.174 0.161 5000 0.171 0.153
Naive Bayes is ahead with 10, 30 and 100 training examples. By 1,000 examples logistic regression has overtaken it, and the gap persists at 5,000: naive Bayes keeps triple-counting the duplicated features, a bias that no amount of data removes, while logistic regression simply learns smaller weights for the copies. Which family to prefer therefore depends on how much labelled data you have, one more reason to compare candidates on validation data rather than by reputation.
Decision theory with probabilities
A probabilistic classifier separates two questions that a hard classifier merges: what is likely, and what should be done. Given posterior probabilities and a loss matrix \(L_{jk}\), the cost of predicting class k when the truth is j, the Bayes decision rule chooses the action with the smallest expected loss \(\sum_j L_{jk} P(y = j \mid \mathbf{x})\). With 0-1 loss this is the most probable class. If missing a fraudulent transaction costs 50 times as much as a false alarm, the rule flags a transaction whenever its fraud probability exceeds 1/51, about 2 per cent, rather than 50 per cent. Priors can also be adjusted at deployment time: if a spam filter was trained when half of all mail was spam and spam now makes up 80 per cent, the posteriors can be corrected by reweighting the prior without retraining the class-conditional models. These manipulations require probabilities that mean what they say, which is the subject of calibration in lesson 9.
Worked examples
Worked problem
Bayes' rule with a rare class
One message in 20 is spam. The word prize appears in 30 per cent of spam and 1 per cent of other mail. Using only this word, what is P(spam | prize)?
Show solution
- P(prize | spam) P(spam) = 0.30 × 0.05 = 0.015.
- P(prize | ham) P(ham) = 0.01 × 0.95 = 0.0095.
- P(spam | prize) = 0.015 / (0.015 + 0.0095) ≈ 0.612.
Answer: About 61 per cent: the word is strong evidence, but because spam is rare the posterior is far from certain.
Worked problem
Laplace smoothing
In the spam class there are 200 word tokens, the vocabulary has 1,000 words and the word refund never appears in spam. Estimate P(refund | spam) with α = 1, and without smoothing.
Show solution
- Without smoothing: 0 / 200 = 0, which would make any message containing refund impossible as spam.
- With α = 1: (0 + 1) / (200 + 1,000) = 1/1,200 ≈ 0.00083.
Answer: About 0.00083: small, but not zero, so other words can still outweigh it.
Worked problem
A Gaussian naive Bayes decision
Equal priors. Feature x has mean 2, standard deviation 1 in class A and mean 5, standard deviation 2 in class B. Classify x = 3.5.
Show solution
- Log density for A: \(-\log 1 - (3.5 - 2)^2 / 2 = -1.125\) (dropping the common constant).
- For B: \(-\log 2 - (3.5 - 5)^2 / 8 \approx -0.693 - 0.281 = -0.974\).
- B has the larger value.
Answer: Class B, even though 3.5 is closer to A's mean in absolute terms, because B's larger variance makes values far from its mean less surprising.
Common mistakes
MistakeNaive Bayes works only when features really are independent.
InsteadIt often classifies well despite dependence; it is the probability estimates that suffer.
MistakeEstimate word probabilities by raw frequencies.
InsteadUnseen words get probability zero and veto a class; use Laplace or other smoothing.
MistakeMultiply the per-word probabilities directly.
InsteadThe product underflows; add log probabilities instead.
MistakeLDA and QDA differ only in speed.
InsteadLDA assumes a shared covariance and gives linear boundaries; QDA estimates one per class and gives quadratic boundaries with many more parameters.
MistakeA discriminative model is always better than a generative one.
InsteadWith little data, generative models often win because their assumptions reduce variance.
Summary and key terms
- Generative classifiers model p(x | y) and P(y) and classify with Bayes' rule; discriminative ones model P(y | x) directly.
- Naive Bayes assumes features are conditionally independent given the class, reducing parameters from exponential to linear in d.
- It often classifies well despite the false assumption, but its probabilities are overconfident.
- Multinomial naive Bayes for text needs Laplace smoothing and log-space arithmetic.
- Gaussian discriminant analysis models each class as a Gaussian: QDA gives quadratic boundaries, LDA (shared covariance) linear ones.
- Gaussian naive Bayes is GDA with diagonal covariances.
- Generative models approach their asymptotic error faster; discriminative models reach lower error with more data.
- Posterior probabilities plus a loss matrix give the Bayes decision rule, which can differ greatly from picking the most probable class.
- Generative model
- A model of how inputs are produced in each class, p(x | y), with class priors.
- Discriminative model
- A model of the conditional distribution P(y | x) or of the decision boundary.
- Naive Bayes
- A generative classifier assuming features are independent given the class.
- Bag of words
- A representation of text by word counts, ignoring order.
- Laplace smoothing
- Adding a pseudo-count to every count to avoid zero probabilities.
- Log-sum-exp trick
- Computing log Σ exp(a_i) stably by factoring out the largest a_i.
- Quadratic discriminant analysis
- Gaussian class models with separate covariances, giving quadratic boundaries.
- Linear discriminant analysis
- Gaussian class models with a shared covariance, giving linear boundaries.
- Bayes decision rule
- Choosing the action with the smallest expected loss under the posterior.
- Loss matrix
- A table of the costs of predicting each class when each class is true.
Practice problems
Work each problem on paper first, then reveal the answer to check.
Why is the denominator of Bayes' rule ignored when classifying?
Show answer
It is the same for every class, so it does not change which class is largest.
How many parameters does naive Bayes need for d binary features and K classes?
Show answer
About dK (plus K − 1 for the priors).
Why are naive Bayes probabilities overconfident?
Show answer
Correlated features are counted as independent evidence.
What does Laplace smoothing correspond to in Bayesian terms?
Show answer
A MAP estimate under a Dirichlet prior.
What extra evidence does Bernoulli naive Bayes use that multinomial does not?
Show answer
The absence of vocabulary words.
When are LDA boundaries linear?
Show answer
Always, because the shared covariance makes the quadratic terms cancel.
Which method won on the invented data with unequal covariances, and why?
Show answer
QDA, because its assumption of separate class covariances matched the data.
In the learning-curve experiment, where does naive Bayes do relatively best?
Show answer
With the smallest training sets.
If missing fraud costs 50 times a false alarm, what probability threshold should flag fraud?
Show answer
1/51, about 0.02.
Give one capability of generative models that discriminative ones lack.
Show answer
Handling missing features by marginalization (or detecting unusual inputs, or generating data).
Lesson quiz · 5 questions
Score 60% or more to complete this lesson.
Create a free account to save your progress, take quizzes and earn a certificate.