
CMPUT-367 · Lesson 11 of 12 · 34 min
Unsupervised learning: clustering and mixture models
Most data have no labels. A retailer has millions of transactions but no list of customer types; an astronomer has spectra of millions of stars but no catalogue of their classes; a hospital has years of sensor readings but no annotation of what each pattern means. Unsupervised learning looks for structure in such data without a target to predict. Clustering, the subject of this lesson, partitions examples into groups whose members are similar to each other and different from members of other groups. Dimensionality reduction, the subject of lesson 12, finds a small number of directions that capture most of the variation. Both are used to explore data, to compress it, to create features for supervised models, and to detect anomalies.
Unsupervised learning is harder to evaluate than supervised learning, because there is no ground truth to compare against. A clustering is useful if it helps someone understand or act on the data, and different clusterings of the same data can all be legitimate. This lesson develops the main methods, k-means, Gaussian mixture models with the EM algorithm, hierarchical clustering and density-based clustering, together with the assumptions each makes about what a cluster is, because choosing a method is choosing a definition.
k-means
k-means represents each of k clusters by a centre \(\boldsymbol{\mu}_j\) and assigns every point to its nearest centre. It seeks the centres and assignments that minimize the within-cluster sum of squared distances, called the inertia or distortion:
where c(i) is the cluster of point i. Finding the global minimum is NP-hard, but Lloyd's algorithm, devised by Stuart Lloyd at Bell Labs in 1957 and published in 1982, finds a local minimum by alternating two steps. In the assignment step, assign each point to the nearest centre. In the update step, move each centre to the mean of its assigned points. Each step can only decrease J: the assignment step chooses the best cluster for each point given the centres, and the update step chooses the best centre for each cluster given the assignments, since the mean minimizes the sum of squared distances. J is bounded below and there are finitely many assignments, so the algorithm converges, usually in a few dozen iterations.
It converges to a local minimum that depends on the starting centres, sometimes a poor one in which two centres share one true cluster while another pair of clusters is merged. The standard remedy is k-means++ seeding (David Arthur and Sergei Vassilvitskii, 2007): choose the first centre at random from the data, then choose each further centre with probability proportional to its squared distance from the nearest centre already chosen. This spreads the initial centres out, and it guarantees an expected inertia within a factor of \(O(\log k)\) of the optimum. In practice one also runs the algorithm several times from different seeds and keeps the best result.
# k-means (Lloyd's algorithm) with k-means++ seeding, written from scratch.
import numpy as np
rng = np.random.default_rng(367)
means_true = np.array([[0, 0], [4, 0], [2, 3.5], [6, 4]])
X = np.vstack([rng.normal(c, 0.7, (75, 2)) for c in means_true])

def kmeans_pp(X, k):
    C = [X[rng.integers(len(X))]]
    for _ in range(k - 1):
        d2 = np.min(((X[:, None] - np.array(C)[None]) ** 2).sum(axis=2), axis=1)
        C.append(X[rng.choice(len(X), p=d2 / d2.sum())])   # far points are more likely to be chosen
    return np.array(C)

def kmeans(X, k, iters=100):
    C = kmeans_pp(X, k)
    for it in range(iters):
        labels = ((X[:, None] - C[None]) ** 2).sum(axis=2).argmin(axis=1)   # assignment step
        newC = np.array([X[labels == j].mean(axis=0) for j in range(k)])     # update step
        if np.allclose(newC, C): break
        C = newC
    inertia = ((X - C[labels]) ** 2).sum()
    return C, labels, inertia, it + 1

def silhouette(X, labels):
    D = np.sqrt(((X[:, None] - X[None]) ** 2).sum(axis=2)); s = []
    for i in range(len(X)):
        same = labels == labels[i]; same[i] = False
        a = D[i, same].mean()
        b = min(D[i, labels == j].mean() for j in set(labels) if j != labels[i])
        s.append((b - a) / max(a, b))
    return np.mean(s)

print(" k   inertia   silhouette   iterations")
for k in (2, 3, 4, 5, 6, 8):
    C, lab, inertia, its = kmeans(X, k)
    print(f"{k:2}  {inertia:8.1f}   {silhouette(X, lab):10.3f}   {its:10}")
C, lab, _, _ = kmeans(X, 4)
print("cluster means found for k = 4:", np.round(C[np.argsort(C[:, 0] + 10 * C[:, 1])], 2).tolist())k inertia silhouette iterations 2 1465.7 0.447 15 3 811.7 0.529 4 4 259.0 0.685 3 5 236.5 0.580 10 6 207.7 0.505 5 8 177.9 0.396 10 cluster means found for k = 4: [[0.11, 0.0], [3.99, 0.04], [1.99, 3.62], [6.01, 3.94]]
Choosing k
Inertia always decreases as k increases, reaching zero when every point is its own cluster, so it cannot choose k by itself. The elbow method plots inertia against k and looks for the point where adding clusters stops helping much; the elbow is often ambiguous. The silhouette coefficient compares, for each point, its mean distance a to other members of its cluster with its mean distance b to members of the nearest other cluster: \(s = (b - a)/\max(a, b)\), between −1 and 1. A high average silhouette means compact, well-separated clusters. In the run above the silhouette is highest at the k used to generate the data. Other criteria include the gap statistic and, for mixture models, information criteria such as BIC. Often the best answer comes from the application: a marketing team may want five segments because it can design five campaigns.
What k-means assumes
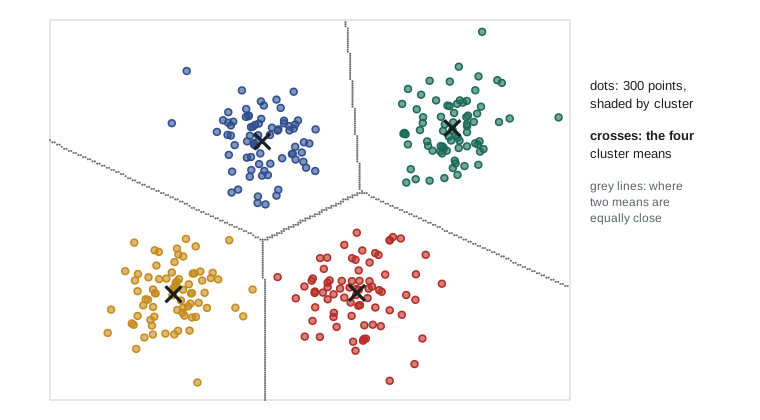
Because each point goes to its nearest centre, the boundaries between k-means clusters are straight lines (hyperplanes) and each cluster is a convex region. Because the objective is squared Euclidean distance, k-means favours roughly spherical clusters of similar size and spread, is sensitive to feature scaling, and is pulled around by outliers. It cannot find elongated, curved or nested clusters. Variants relax some assumptions: k-medoids uses actual data points as centres and any distance; mini-batch k-means scales to very large data; kernel k-means works in a feature space. When clusters differ in shape and size, a probabilistic model is a better fit.
Gaussian mixture models
A Gaussian mixture model (GMM) assumes each point was generated by first choosing a component k with probability \(\pi_k\), then drawing from a Gaussian with mean \(\boldsymbol{\mu}_k\) and covariance \(\Sigma_k\). The density of the data is
This is the generative model of lesson 8 with the class label unobserved, a latent variable. Instead of a hard assignment, a GMM gives each point a responsibility \(r_{ik} = P(z_i = k \mid \mathbf{x}_i)\), the posterior probability that it came from component k. Clusters can be elliptical, tilted and of different sizes, and points between clusters are honestly uncertain. A GMM is also a density estimate, which can flag anomalies as points of low density.
The EM algorithm
Maximizing the likelihood of a mixture directly is awkward, because the logarithm of a sum does not simplify. The expectation–maximization (EM) algorithm of Arthur Dempster, Nan Laird and Donald Rubin (1977) alternates two easy steps. In the E step, compute the responsibilities using the current parameters and Bayes' rule. In the M step, re-estimate each component's weight, mean and covariance as weighted averages, weighting each point by its responsibility:
Each iteration never decreases the likelihood, and the algorithm converges to a local maximum. k-means is a limiting case of EM for a GMM with equal spherical covariances shrinking to zero, in which responsibilities become hard 0-or-1 assignments. AI-320's lesson on latent variables derives EM in general, as coordinate ascent on a lower bound of the log-likelihood, and applies it to other models such as hidden Markov models.
# A Gaussian mixture model fitted by EM, from scratch, in one dimension.
import numpy as np
rng = np.random.default_rng(2)
# invented data: commute times (minutes) from two groups, transit riders and drivers
x = np.r_[rng.normal(42, 8, 300), rng.normal(22, 5, 200)]

def normal_pdf(x, mu, sd):
    return np.exp(-0.5 * ((x - mu) / sd) ** 2) / (sd * np.sqrt(2 * np.pi))

pi, mu, sd = np.array([0.5, 0.5]), np.array([15.0, 60.0]), np.array([10.0, 10.0])   # a poor start
for it in range(1, 201):
    # E step: responsibility of each component for each point
    dens = pi * np.column_stack([normal_pdf(x, mu[k], sd[k]) for k in range(2)])
    r = dens / dens.sum(axis=1, keepdims=True)
    loglik = np.log(dens.sum(axis=1)).sum()
    # M step: weighted maximum likelihood estimates
    Nk = r.sum(axis=0)
    pi, mu = Nk / len(x), (r * x[:, None]).sum(axis=0) / Nk
    sd = np.sqrt((r * (x[:, None] - mu) ** 2).sum(axis=0) / Nk)
    if it in (1, 2, 5, 20, 200):
        print(f"iteration {it:3}: log-likelihood {loglik:9.2f}  weights {np.round(pi, 3)}  means {np.round(mu, 2)}  sds {np.round(sd, 2)}")
print(f"P(transit group | 30 minutes) = {r[np.argmin(np.abs(x - 30)), np.argmax(mu)]:.2f} (for the observation nearest 30)")iteration 1: log-likelihood -2371.32 weights [0.595 0.405] means [25.61 45.45] sds [7.47 6.32] iteration 2: log-likelihood -1926.34 weights [0.584 0.416] means [25.43 45.14] sds [7.45 6.47] iteration 5: log-likelihood -1923.60 weights [0.553 0.447] means [24.83 44.56] sds [7.09 6.72] iteration 20: log-likelihood -1913.71 weights [0.437 0.563] means [22.35 42.38] sds [5.31 7.67] iteration 200: log-likelihood -1912.05 weights [0.383 0.617] means [21.45 41.2 ] sds [4.72 8.4 ] P(transit group | 30 minutes) = 0.65 (for the observation nearest 30)
From a deliberately poor start, EM moves the components toward the two groups within a few iterations and then refines them slowly, with the log-likelihood rising at every step. The recovered weights, means and standard deviations are close to the values used to generate the data (60 per cent transit riders averaging 42 minutes, 40 per cent drivers averaging 22). A 30-minute commute is ambiguous, and the model says so with a responsibility between the extremes rather than forcing a choice.
GMMs have pitfalls of their own. A component can collapse onto a single point, its variance shrinking toward zero and its likelihood growing without bound; implementations guard against this by adding a small constant to the covariance diagonal or by placing priors on the parameters. Full covariance matrices have many parameters in high dimensions, so diagonal or tied covariances are common simplifications. And like k-means, EM finds local optima, so multiple restarts, often initialized from k-means, are standard.
Hierarchical clustering
Hierarchical clustering builds a tree of nested clusters rather than a single partition. Agglomerative clustering starts with every point as its own cluster and repeatedly merges the two closest clusters until one remains. The result is drawn as a dendrogram, whose merge heights show how far apart the merged clusters were; cutting the dendrogram at a chosen height gives a partition, and the tree shows the structure at every scale at once, which is valuable for exploration and is the norm in fields such as phylogenetics and gene-expression analysis.
The definition of distance between clusters, the linkage, determines the result. Single linkage uses the closest pair of points and can follow long, thin chains, finding elongated clusters but also chaining distinct clusters together through a few intermediate points. Complete linkage uses the farthest pair and produces compact clusters. Average linkage uses the mean pairwise distance. Ward's method merges the pair that least increases total within-cluster variance, giving results similar to k-means. Naive agglomerative clustering costs \(O(n^2)\) memory and at least \(O(n^2)\) time, so it suits thousands of points, not millions.
Density-based clustering
DBSCAN (Martin Ester, Hans-Peter Kriegel, Jörg Sander and Xiaowei Xu, 1996) defines clusters as dense regions separated by sparse ones. A point is a core point if at least min_samples points lie within distance eps of it. Clusters grow by connecting core points that are within eps of each other, together with the border points near them; points that belong to no cluster are labelled noise. DBSCAN finds clusters of arbitrary shape, determines their number automatically, and identifies outliers explicitly. It struggles when clusters have very different densities, which HDBSCAN addresses by considering all density levels, and its parameters must be chosen with the scale of the data in mind.
# k-means, single and Ward linkage, and DBSCAN on two interleaved half-moons.
import numpy as np
from sklearn.cluster import KMeans, AgglomerativeClustering, DBSCAN
from sklearn.metrics import adjusted_rand_score
rng = np.random.default_rng(0)
a = rng.uniform(0, np.pi, 200)
X = np.vstack([np.column_stack([np.cos(a[:100]), np.sin(a[:100])]),
               np.column_stack([1 - np.cos(a[100:]), 0.5 - np.sin(a[100:])])]) + rng.normal(0, 0.06, (200, 2))
truth = np.repeat([0, 1], 100)
models = {"k-means (k=2)": KMeans(2, n_init=10, random_state=0),
          "agglomerative, Ward": AgglomerativeClustering(2, linkage="ward"),
          "agglomerative, single link": AgglomerativeClustering(2, linkage="single"),
          "DBSCAN (eps=0.2, min_samples=5)": DBSCAN(eps=0.2, min_samples=5)}
for name, m in models.items():
    lab = m.fit_predict(X)
    extra = f"  clusters found {len(set(lab) - {-1})}, noise points {np.sum(lab == -1)}" if "DBSCAN" in name else ""
print(f"{name:32} adjusted Rand index {adjusted_rand_score(truth, lab):6.3f}{extra}")k-means (k=2) adjusted Rand index 0.288 agglomerative, Ward adjusted Rand index 0.420 agglomerative, single link adjusted Rand index 1.000 DBSCAN (eps=0.2, min_samples=5) adjusted Rand index 1.000 clusters found 2, noise points 0
The adjusted Rand index (ARI) measures agreement between a clustering and a reference labelling, corrected for chance: 1 means perfect agreement, 0 means no better than random. Here the reference is the moon each point was generated from, available only because the data are invented. k-means and Ward linkage cut the moons with a straight boundary and score poorly, because they assume compact clusters. Single linkage and DBSCAN follow the curved shapes. With real data no reference exists, which is why internal measures such as the silhouette, stability under resampling and above all usefulness to the people who will act on the clusters are what count.
Clustering in practice
A few practical habits apply to all methods. Scale features first, since every method depends on distances or variances. Remember that a clustering algorithm will always return clusters, even from data with no structure at all; check stability by rerunning on bootstrap samples or subsets, and compare against clusterings of shuffled data. Interpret clusters by describing them (feature means, typical examples) and validate them against external information where possible. Beware of treating clusters as natural kinds: segmenting customers or patients into groups can be useful, but clusters found in data reflect the features chosen and the method used as much as any underlying reality, and decisions applied to whole clusters can treat individuals unfairly.
Worked examples
Worked problem
One iteration of k-means
Points 1, 2, 3, 8, 9, 12 on a line, with initial centres 2 and 9. Perform one assignment and one update step.
Show solution
- Assignment: 1, 2, 3 are closer to 2; 8, 9, 12 are closer to 9.
- Update: new centres are (1 + 2 + 3)/3 = 2 and (8 + 9 + 12)/3 ≈ 9.67.
- Reassigning with centres 2 and 9.67 changes nothing, so the algorithm has converged.
Answer: Clusters {1, 2, 3} and {8, 9, 12}, centres 2 and 9.67; inertia = 2 + (2.78 + 0.44 + 5.44) ≈ 10.67.
Worked problem
A responsibility
A two-component 1-D mixture has π = (0.6, 0.4), means 42 and 22, standard deviations 8 and 5. Compute the responsibility of component 1 for x = 30.
Show solution
- Component 1: \(0.6 \times \mathcal{N}(30 \mid 42, 8) = 0.6 \times \frac{1}{8\sqrt{2\pi}} e^{-1.125} \approx 0.6 \times 0.0162 = 0.00971\).
- Component 2: \(0.4 \times \frac{1}{5\sqrt{2\pi}} e^{-1.28} \approx 0.4 \times 0.0222 = 0.00887\).
- Responsibility = 0.00971 / (0.00971 + 0.00887) ≈ 0.52.
Answer: About 0.52: the point is almost equally likely to have come from either group.
Worked problem
A silhouette value
A point's mean distance to its own cluster is 1.2 and to the nearest other cluster is 3.0. Compute its silhouette. What if the distances were 2.5 and 2.0?
Show solution
- s = (3.0 − 1.2)/3.0 = 0.6.
- Second case: s = (2.0 − 2.5)/2.5 = −0.2.
Answer: 0.6 (well clustered) and −0.2 (closer on average to another cluster, probably misassigned).
Common mistakes
MistakeChoose k by minimizing the k-means inertia.
InsteadInertia always falls as k grows; use the silhouette, information criteria, stability or the needs of the application.
MistakeRun k-means once from random centres.
InsteadUse k-means++ seeding and several restarts, keeping the lowest inertia.
Mistakek-means can find clusters of any shape.
InsteadIts clusters are convex regions around centres; use DBSCAN, single linkage or spectral methods for curved shapes.
MistakeA clustering algorithm's output proves the data contain natural groups.
InsteadEvery algorithm returns clusters; check stability and compare with structureless data.
MistakeEM always finds the maximum likelihood mixture.
InsteadIt finds a local maximum and can collapse onto single points; restart and regularize covariances.
Summary and key terms
- Clustering groups similar examples without labels; each method embodies a definition of a cluster.
- k-means minimizes within-cluster squared distance by alternating assignment and update steps; it converges to a local minimum.
- k-means++ seeding and multiple restarts give much better solutions.
- Inertia cannot choose k; the silhouette, information criteria and the application can.
- Gaussian mixtures give soft, elliptical clusters and a density; EM fits them by alternating responsibilities and weighted estimates.
- Agglomerative clustering builds a dendrogram; the linkage determines cluster shapes.
- DBSCAN finds dense regions of any shape, chooses the number of clusters and labels noise.
- Evaluate clusterings by stability and usefulness; external indices such as ARI need reference labels.
- Clustering
- Partitioning examples into groups of similar items without labels.
- k-means
- Clustering that minimizes squared distances from points to their cluster centres.
- Inertia
- The within-cluster sum of squared distances that k-means minimizes.
- k-means++
- Seeding that picks initial centres with probability proportional to squared distance.
- Silhouette coefficient
- A per-point measure (b − a)/max(a, b) of how well it fits its cluster.
- Gaussian mixture model
- A density that is a weighted sum of Gaussian components.
- Responsibility
- The posterior probability that a component generated a given point.
- EM algorithm
- An iterative method alternating expectation and maximization steps for latent-variable models.
- Dendrogram
- A tree diagram recording the merges of hierarchical clustering.
- Linkage
- The rule defining distance between clusters in hierarchical clustering.
- DBSCAN
- Density-based clustering that grows clusters from core points and labels noise.
- Adjusted Rand index
- A chance-corrected measure of agreement between two partitions.
Practice problems
Work each problem on paper first, then reveal the answer to check.
Why does each step of Lloyd's algorithm decrease the inertia?
Show answer
Assignment picks the nearest centre for each point; the mean is the point minimizing squared distance to a cluster.
What does k-means++ do?
Show answer
Chooses each initial centre with probability proportional to its squared distance from existing centres.
Why can inertia not choose k?
Show answer
It decreases monotonically with k, reaching zero at k = n.
What shape are k-means clusters?
Show answer
Convex regions (Voronoi cells) around the centres.
What is a latent variable in a GMM?
Show answer
The unobserved component that generated each point.
What happens in the M step?
Show answer
Weights, means and covariances are re-estimated as responsibility-weighted averages.
How is k-means related to EM?
Show answer
It is the limit of EM for spherical Gaussians with variance shrinking to zero (hard assignments).
Which linkage can follow long chains of points?
Show answer
Single linkage.
What are DBSCAN's two parameters?
Show answer
eps (the neighbourhood radius) and min_samples.
What does an adjusted Rand index of 0 mean?
Show answer
Agreement no better than chance.
Lesson quiz · 5 questions
Score 60% or more to complete this lesson.
Create a free account to save your progress, take quizzes and earn a certificate.