
CMP-450 · Lesson 12 of 12 · 21 min
Verification, debug and capstone (NS-5 sensor front-end accelerator)
The last lesson brings the course together. It covers the verification and debug techniques that go beyond the simulation of lesson 4: formal methods, equivalence and lint checks, on-chip logic analysis, hardware-in-the-loop testing and the discipline of bringing up a new board. It then assembles the complete NS-5 sensor front-end accelerator from the blocks of lessons 2 to 11, checks it against its requirements, and sets out what it takes to keep an FPGA design healthy in the field for years.
The first revision B boards have arrived from assembly, and the Ontario Ministry of Transportation pilot in Kingston starts in eight weeks. Ines Carvalho has set the bar plainly: before any board goes on a pole, the front end must pass its full regression, meet timing with margin on the final build, survive a week of continuous operation on the bench and be updatable in the field without a truck roll.
Formal verification
Simulation shows that a design works for the inputs that were tried. Formal verification proves properties for all inputs, by analyzing the design mathematically rather than executing it. Model checking takes a design and a set of assertions, the same SVA properties written in lesson 4, and either proves that no sequence of inputs can violate them or produces a counterexample, a short trace that shows exactly how the violation happens. Because the tools explore every possible input at every cycle, they find corner cases that random simulation would take years to hit.
Full proofs can be expensive for large designs, so formal tools often run bounded model checking, which proves that no violation can occur within the first k cycles from reset. For control logic with short sequential depth, such as FIFO pointer logic, handshakes, arbiters and the capture controller, a bound of a few dozen cycles covers every reachable behaviour, and the bounded proof is in practice complete. The NS-5's asynchronous FIFO, skid buffers and register block are each verified formally against their assertions: no overflow, no underflow, no data reordering, valid held until ready, and correct write-one-to-clear behaviour. Datapaths with wide arithmetic, like the filter, are better verified by simulation against the bit-accurate model, because their state spaces are enormous and their bugs are mostly arithmetic.
Formal tools also answer a different question: whether two descriptions of a design are equivalent. Equivalence checking compares the RTL with the synthesized netlist, or one version of the RTL with another after an optimization, and proves that they produce the same outputs for every input sequence. It is the standard check that synthesis, retiming and manual edits have not changed the function, and it is far faster than rerunning every simulation on the gate-level netlist.
Static checks
Two kinds of static analysis catch problems that neither simulation nor formal property checking is designed to find. Lint tools check the RTL against coding rules: width mismatches, unintended latches, incomplete case statements, signals with multiple drivers, unused signals and the many sign and width pitfalls of lesson 2. CDC tools, described in lesson 8, check every clock-domain crossing structurally. Both run in seconds on the RTL and belong in the continuous-integration pipeline next to the regression, so that a new latch or an unsynchronized crossing is reported on the commit that introduced it.
Debugging in hardware
When a design misbehaves on the board, the designer needs to see inside the chip. An on-chip logic analyzer is a debug core, inserted into the design by the tools or by hand, that samples chosen internal signals on a chosen clock into block RAM when a trigger condition occurs and uploads the capture through the JTAG port, the IEEE 1149.1 test access port that every FPGA provides. The designer selects the signals, sets a trigger such as fifo_ovf rising or state equal to FLUSH for more than 100 cycles, and views the captured waveform in a viewer much like a simulator's. The cost is fabric and memory, and the capture depth is limited by the block RAM devoted to it.
Two practices make hardware debug productive. The first is to design for it: route key internal signals, such as state machine states, FIFO levels and handshake signals, to a debug bus that the logic analyzer can tap without rebuilding, and include counters and sticky flags in the register map so that firmware can report anomalies without a debug core at all. The second is to reproduce hardware failures in simulation as soon as possible: once a capture shows the sequence of events, a directed test can recreate it in the testbench, where every signal is visible and the fix can be verified in minutes rather than rebuilds.
Hardware-in-the-loop testing puts the real FPGA in a controlled environment. The NS-5 ADC has a test-pattern mode, selected over SPI, in which it outputs a known ramp instead of samples; with it, the bench rig can check the entire capture, crossing, filter, buffer and DMA path against the Python model's output for the same ramp, frame after frame, with firmware computing a checksum of each frame. A signal generator driving the antenna inputs with tones then checks the analog path and the filter response together. These tests run for days on the bench, which is how rare problems such as a stall longer than the 150 µs design value would show up.
Bringing up a board
Board bring-up follows a fixed order, from the simplest thing that could be wrong to the most complex. Power rails and their sequencing first, then clocks, measured at the pins. Then configuration: the bitstream loads from flash, the done pin rises, and the JTAG chain identifies the device. Then a minimal design that blinks an LED and echoes characters on the UART, which proves that the clocks, resets, pin assignments and constraints are basically right. Then each interface alone, starting with the ADC's SPI configuration and test pattern, then the capture path, then the processor's register access, then DMA. Only then the full design. Each step has a check that must pass before the next, and each result is recorded in the bring-up log. Jonah's log for board 3 records one real fault found this way: a swapped pair of ADC data lines, visible at once in the test-pattern ramp and corrected with a pin assignment change rather than a board rework.
The capstone: the NS-5 front-end accelerator
The table restates the front end's requirements, gathered across the course, with the lesson that addressed each and the result on the final build.
| Requirement | Design | Result |
|---|---|---|
| 4 channels, 12 bits, 2 MS/s each | ADC capture on adc_clk, async FIFO 512 × 48 (lessons 3, 7, 8) | met; FIFO never above 3 entries in bench runs |
| Low-pass, at least 40 dB above 350 kHz, linear phase | 32-tap symmetric FIR, Q1.15 coefficients (lesson 6) | 43 dB at 350 kHz, bit-exact against the model |
| Decimate by 4 to 500 kS/s, 16-bit output | one time-shared MAC engine with pre-adder, 18 cycles per output (lessons 1, 6) | 36 % engine load |
| 1,024-sample frames to processor memory | ping-pong buffers, DMA FIFO 256 × 32, valid and ready stream (lessons 7, 10) | peak FIFO 201 of 256 in stall simulation |
| RMS per channel per frame | iterative square root, 18 cycles (lesson 5) | 0.04 % busy |
| Configuration and status | SPI master at 25 MHz, register block, interrupt (lessons 10, 11) | register map generated for RTL and firmware |
| Debug console | UART at 115,200 baud (lesson 10) | +0.47 % rate error |
| 100 MHz with at least 0.3 ns margin | pipelined block RAM and DSP paths, constraints (lesson 9) | WNS +1.42 ns, WHS +0.06 ns |
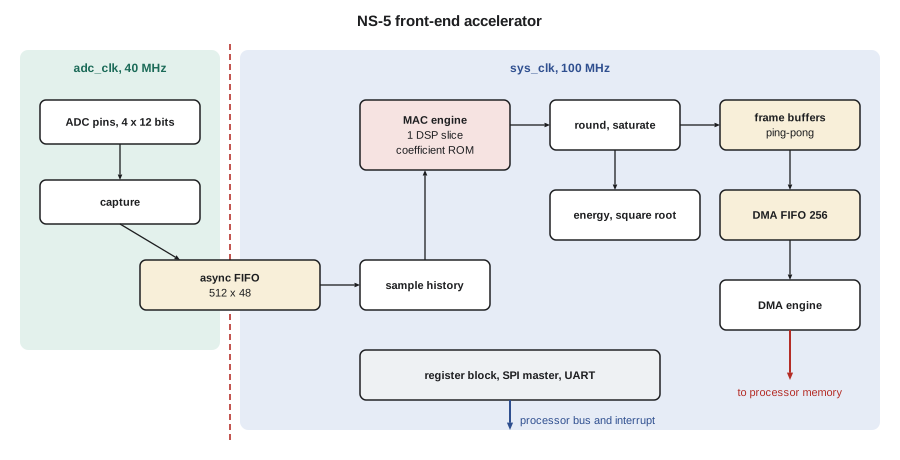
The code below collects the final numbers: resources after implementation, with and without the on-chip logic analyzer used during bring-up; the engine load and the data rate into memory; the worst-case latency from the last sample of a frame to the interrupt; the timing summary for each clock at the slow corner; and an early power estimate with illustrative per-resource coefficients of the kind a vendor power estimator would supply.
from math import ceil

F_SYS = 100e6
FRAME_T = 1024 / 500e3                      # one frame of decimated samples: 2.048 ms

# 1. resources after implementation against the device
dev = {"LUT": 20_800, "FF": 41_600, "BRAM36": 50, "DSP": 90}
used = {"LUT": 1_486, "FF": 1_742, "BRAM36": 6, "DSP": 2}
ila = {"LUT": 610, "FF": 1_150, "BRAM36": ceil(4096 / 512) * ceil(64 / 72), "DSP": 0}
print("resources       used  with debug core  device   utilization")
for k in dev:
    print(f"  {k:7s} {used[k]:9,d} {used[k] + ila[k]:12,d} {dev[k]:10,d}"
          f"   {100 * used[k] / dev[k]:4.1f} % / {100 * (used[k] + ila[k]) / dev[k]:4.1f} %")

# 2. throughput: cycles needed per second against cycles available
mac = 4 * 500e3 * 18                      # MAC engine: 18 cycles per output
print(f"MAC engine load {100 * mac / F_SYS:.0f} %;  stream into memory "
      f"{4 * 500e3 * 2 / 1e6:.1f} MB/s")

# 3. latency from the last sample of a frame to the interrupt, worst case
flush = 80 / F_SYS                        # pipeline flush for four channels
dma = 8192 / 400e6                        # 8 KiB at an effective 400 MB/s
stall = 150e-6                            # worst measured interconnect stall
irq = 5e-6                                # interrupt entry on the real-time core
total = flush + dma + stall + irq
print(f"frame latency: flush {flush*1e6:.1f} us + DMA {dma*1e6:.1f} us + stall {stall*1e6:.0f} us"
      f" + interrupt {irq*1e6:.0f} us = {total*1e6:.1f} us"
      f" ({100 * total / FRAME_T:.1f} % of the {FRAME_T*1e3:.3f} ms frame)")

# 4. timing summary from the final build, slow corner
for clk, wns, whs in [("sys_clk 100 MHz", 1.42, 0.06), ("adc_clk 40 MHz", 14.8, 0.11),
                      ("spi_sck generated 25 MHz", 3.05, 0.42)]:
    ok = wns >= 0.3 and whs >= 0
    print(f"  {clk:24s} WNS {wns:+6.2f} ns  WHS {whs:+5.2f} ns  {'meets margin' if ok else 'FAILS'}")

# 5. power estimate with illustrative per-resource coefficients
static = 0.120                                       # W, at 50 degrees C junction
dyn = {"logic and routing": used["LUT"] * 0.06e-6 * 100,     # W per LUT per MHz, 12.5 % activity
       "block RAM": used["BRAM36"] * 25e-6 * 100 * 0.5,
       "DSP slices": used["DSP"] * 15e-6 * 100 * 0.36,
       "clock network": 0.015, "input and output": 0.020}
for k, v in dyn.items():
    print(f"  {k:18s} {1000 * v:6.1f} mW")
p = static + sum(dyn.values())
print(f"total {1000 * p:.0f} mW (static {1000 * static:.0f} mW, dynamic {1000 * sum(dyn.values()):.0f} mW)")resources used with debug core device utilization LUT 1,486 2,096 20,800 7.1 % / 10.1 % FF 1,742 2,892 41,600 4.2 % / 7.0 % BRAM36 6 14 50 12.0 % / 28.0 % DSP 2 2 90 2.2 % / 2.2 % MAC engine load 36 %; stream into memory 4.0 MB/s frame latency: flush 0.8 us + DMA 20.5 us + stall 150 us + interrupt 5 us = 176.3 us (8.6 % of the 2.048 ms frame) sys_clk 100 MHz WNS +1.42 ns WHS +0.06 ns meets margin adc_clk 40 MHz WNS +14.80 ns WHS +0.11 ns meets margin spi_sck generated 25 MHz WNS +3.05 ns WHS +0.42 ns meets margin logic and routing 8.9 mW block RAM 7.5 mW DSP slices 1.1 mW clock network 15.0 mW input and output 20.0 mW total 172 mW (static 120 mW, dynamic 52 mW)
The final design uses about 7 % of the LUTs, 6 block RAMs and 2 DSP slices, one for the filter and one for the energy detector added in lesson 9. The debug core, capturing 64 signals 4,096 samples deep, needs 8 more block RAMs, which is why it is included only in bench builds. The worst-case frame latency is 176 µs, 8.6 % of the 2.048 ms frame, dominated by the measured interconnect stall; the radar task in firmware therefore has the frame in memory long before it needs it. Timing meets the 0.3 ns margin on every clock. The power estimate of about 172 mW is dominated by static power and the fixed costs of the clock network and input and output, which is typical of a lightly used device and suggests that a smaller, cheaper part could be considered for the NS-5 Lite.
Compared with the starting point in CMP-440, where the radar task needed 1.2 ms of processor time every 6.25 ms on the old microcontroller, the front end removes the filtering from software entirely. The radar task now handles four channels instead of two at twice the sample rate, and its remaining work is the 15 % of bookkeeping and feature extraction identified by the Amdahl calculation in lesson 11.
Verification summary
The front end's verification plan, reviewed by Ines and Maren before the release build, lists every feature, the method that verifies it and the coverage goal. The block-level regression contains 46 tests with 20 seeds each; the integration regression runs the full front end against the Python model for 200 frames per test; formal proofs cover the FIFOs, skid buffers, register block and capture controller; lint and CDC reports are clean with every waiver explained; and the hardware-in-the-loop rig has run for 7 days, about 295 million frames, with no checksum failure and a peak DMA FIFO level of 112 entries. Functional coverage of the test plan is complete. Code coverage stands at 98 % of lines and 96 % of branches; each uncovered item was reviewed and is either unreachable recovery logic for illegal states or a debug feature disabled in the product build.
Living with the design in the field
An FPGA design ships, but it is not finished. Three concerns govern its life in the field. Updates must be safe: the NS-5 flash holds a golden bitstream that is never overwritten and an update slot. A new bitstream is written to the update slot and verified by checksum before the configuration pointer is changed, and if the new image fails to configure or the firmware watchdog expires repeatedly, the configuration logic falls back to the golden image, so a failed update can never leave a unit unreachable on its pole. Updates must be authentic: the bitstream is signed, and the device verifies the signature before loading it, so that only Northway Sensing's images run; encryption protects the design itself.
Upsets must be handled. At ground level, neutrons from cosmic rays occasionally flip a configuration memory cell, which can change the function of a LUT or a routing switch until the next reconfiguration. For one unit the rate is low, but over a fleet of thousands running for years, upsets will happen. The NS-5 enables the device's configuration scrubbing, which continuously reads back the configuration memory, detects errors with an error-correcting code and repairs them; the firmware logs each correction, so that the server team, through Dana Okoye's fleet dashboard, can see the upset rate across the deployment and confirm that it matches expectations. Error-correcting codes on the block RAMs that hold frame data, and the watchdog that restarts the front end if a frame does not complete, cover the remaining cases.
And the design must stay maintainable. The source, constraints, Python models, testbenches, regression scripts and the exact tool version used for each released bitstream are kept under version control together, so that a fix two years from now can rebuild the same design and change only what is intended. Timing margin, recorded at each release, shows whether a later change is eating into it. The register map, the requirements table and the verification plan are living documents. These habits are less visible than any block in the design, but they are what makes it possible to keep a product working in the field for the ten years a roadside sensor is expected to last.
What you can now do
Over twelve lessons you have taken the NS-5 front end from a resource estimate to a verified, timed, debuggable design. You can write synthesizable SystemVerilog that means the same thing to simulators and synthesis tools; design state machines, datapaths and controllers from ASM charts; build fixed-point filters that are bit-exact against a reference; size memories and FIFOs from worst-case analysis; cross clock domains safely; close timing with pipelining and constraints; build standard interfaces; decide what belongs in hardware and in software; and verify a design with self-checking testbenches, assertions, coverage, formal tools and hardware tests. The capstone project in CMP-499 will ask you to do all of this as part of a team, for a system of your own choosing.
Common mistakes
MistakeRelying only on simulation for control logic with subtle corner cases.
InsteadProve FIFO, handshake and controller properties formally, and simulate datapaths against bit-accurate models.
MistakeDebugging in hardware by repeatedly rebuilding with different probes.
InsteadDesign in debug buses, counters and sticky flags, and reproduce each hardware failure in simulation quickly.
MistakeBringing up the complete design on a new board first.
InsteadBring up power, clocks, configuration, a minimal design and each interface in order, logging each check.
MistakeOverwriting the only bitstream in flash during a field update.
InsteadKeep a golden image, verify updates before switching, and fall back automatically on failure.
MistakeIgnoring configuration upsets because they are rare in one unit.
InsteadEnable scrubbing, protect memories with ECC and log corrections across the fleet.
Summary and key terms
- Formal model checking proves assertions for all inputs; bounded proofs suit control logic, and equivalence checking compares RTL with netlists.
- Lint and CDC checks run statically on every commit.
- On-chip logic analyzers capture internal signals into block RAM via JTAG; design for debug and reproduce failures in simulation.
- Hardware-in-the-loop tests with ADC test patterns and checksums verify the full path for days.
- The NS-5 front end uses about 7 % of LUTs, 6 block RAMs and 2 DSP slices, meets 100 MHz with +1.42 ns WNS and delivers frames 176 µs after their last sample.
- Golden-image updates, signed bitstreams, scrubbing and version-controlled builds keep a design healthy in the field.
- Formal verification
- Mathematical proof that a design satisfies properties for all possible inputs.
- Bounded model checking
- Formal proof that no property violation can occur within a fixed number of cycles from reset.
- Equivalence checking
- Formal comparison proving that two descriptions of a design have the same behaviour.
- Lint
- Static analysis of RTL against coding rules and common error patterns.
- On-chip logic analyzer
- A debug core that captures internal signals into on-chip memory when a trigger occurs.
- JTAG
- The IEEE 1149.1 test access port used for configuration, boundary scan and debug.
- Golden image
- A protected bitstream that a device falls back to if an updated image fails.
- Configuration scrubbing
- Continuous readback and correction of an FPGA's configuration memory to repair upsets.
Practice problems
Work each problem on paper first, then reveal the answer to check.
How many 36 Kbit block RAMs does a logic analyzer capturing 128 signals 8,192 samples deep need?
Show answer
Using 512 × 72, two blocks wide and 16 deep: 32 blocks.
Why is bounded model checking with a bound of 30 cycles effectively complete for a 16-entry FIFO's pointer logic?
Show answer
Every reachable pointer state can be reached within a few dozen cycles from reset, so all behaviour is covered within the bound.
If the measured stall grew to 1 ms, would frames still reach memory within the frame period?
Show answer
Yes, 0.8 + 20.5 + 1,000 + 5 ≈ 1,026 µs < 2,048 µs, but the DMA FIFO would need about 1,064 entries and would overflow at 256.
Why must the build record the exact tool version for each released bitstream?
Show answer
Different tool versions can produce different placements and timing, so reproducing a released design requires the same version.
Lesson quiz · 5 questions
Score 60% or more to complete this lesson.
Create a free account to save your progress, take quizzes and earn a certificate.