
CIV-280 · Lesson 5 of 12 · 21 min
Water quality parameters and drinking water standards
Clean water is not just water without visible dirt. A glass of crystal-clear well water can carry enough nitrate to harm an infant, enough arsenic to raise lifetime cancer risk or a few protozoan cysts that will make a whole family sick. Murky river water, on the other hand, may be perfectly safe once treated. To decide whether water is fit for drinking, swimming, fish or irrigation, engineers measure a set of physical, chemical and biological parameters and compare them with guidelines and standards. This lesson describes the main parameters, explains the oxygen demand tests that measure organic pollution, introduces the microbiological indicators of faecal contamination, and summarizes how drinking water quality is regulated.
Willowbend's farming-town job brings these ideas together. The town of about 1,800 people draws its water from three wells in a shallow sand-and-gravel aquifer beneath cropland. Residents have complained about staining and a metallic taste, and a routine sample showed nitrate close to the guideline. The town council has asked Willowbend to review the water quality and recommend what to do.
Physical parameters
Turbidity is the cloudiness of water caused by suspended particles such as clay, silt, algae and organic matter. It is measured by shining light through a sample and recording how much is scattered, in nephelometric turbidity units (NTU). Turbidity matters for more than appearance: particles can shield microorganisms from disinfection and carry adsorbed contaminants, so treated drinking water must have very low turbidity, typically below 0.3 NTU after filtration.
Suspended solids are the particles retained on a filter, measured by weighing the dried filter; dissolved solids pass through and are measured by evaporating the filtrate. Total dissolved solids (TDS) above about 500 mg/L give water a salty or bitter taste and can damage crops and pipes. Temperature controls reaction rates, the oxygen that water can hold and the habitat available to fish. Colour usually comes from dissolved organic matter leached from soils and wetlands, and taste and odour from algae, minerals or industrial chemicals. Although many of these are aesthetic concerns, consumers judge their water by them, and water that looks or tastes bad drives people to less safe sources.
Dissolved oxygen
Dissolved oxygen (DO) is essential to fish and to the aerobic bacteria that break down organic matter. The amount of oxygen water can hold at equilibrium with the air, the saturation concentration, falls as temperature rises: about 14.6 mg/L at 0 °C, 11.3 mg/L at 10 °C, 9.1 mg/L at 20 °C and 7.6 mg/L at 30 °C at sea level, and less at high elevation or in salty water. Most fish need at least 5 to 6 mg/L, and sensitive species such as trout need more. Organic pollution lowers DO as bacteria consume it, which is the subject of lesson 6.
Oxygen demand tests
Organic pollution is rarely measured compound by compound, because sewage and many industrial wastes contain thousands of different organic chemicals. Instead, engineers measure the oxygen needed to break the organic matter down. The biochemical oxygen demand (BOD) is the oxygen consumed by bacteria as they oxidize organic matter in a sample kept in the dark at 20 °C. The standard test runs for five days, giving the BOD₅.
In the test, a small volume of sample is diluted with oxygen-saturated water containing nutrients and bacteria, sealed in a 300 mL bottle, and incubated. The DO is measured at the start and after five days. The BOD₅ is the oxygen used, corrected for dilution:
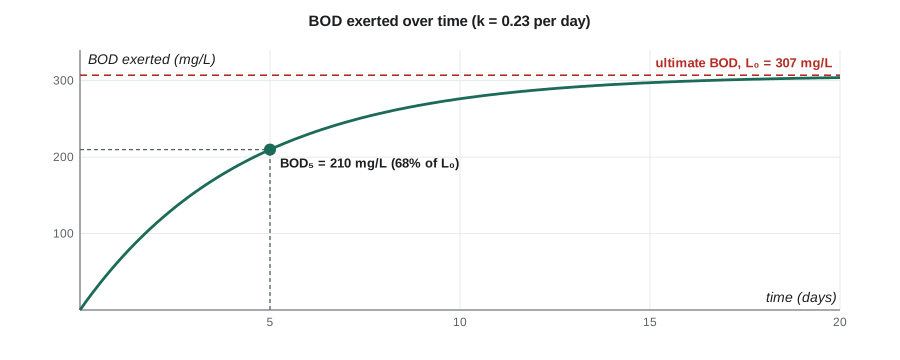
D₁ and D₂ are the initial and final DO in mg/L, and P is the decimal fraction of sample in the bottle. The dilution is chosen so that at least 2 mg/L of oxygen is consumed and at least 1 mg/L remains. Because microorganisms continue to consume oxygen after five days, the BOD rises toward an ultimate value L₀, usually following first-order kinetics:
Worked problem
A BOD test on raw wastewater
Joy places 6.0 mL of raw wastewater in a 300 mL BOD bottle and fills it with dilution water. The initial DO is 8.6 mg/L and the DO after five days at 20 °C is 4.4 mg/L. Find the BOD₅, and estimate the ultimate BOD if k = 0.23 per day.
Show solution
- \[P = \frac{6.0}{300} = 0.020\]
- \[\text{BOD}_5 = \frac{8.6 - 4.4}{0.020} = 210\ \text{mg/L}\]
- \[L_0 = \frac{210}{1 - e^{-0.23 \times 5}} = \frac{210}{0.683} = 307\ \text{mg/L}\]
Answer: The wastewater has a BOD₅ of 210 mg/L, typical of municipal sewage, and an ultimate carbonaceous BOD of about 310 mg/L. Nitrogenous oxygen demand from nitrification can add more, which is why some permits specify carbonaceous BOD (CBOD), measured with a chemical that stops nitrification.
The chemical oxygen demand (COD) test uses a strong chemical oxidant, potassium dichromate in hot acid, to oxidize almost all organic matter in about two hours. COD is always larger than BOD because it includes organic matter that bacteria cannot easily degrade. The ratio of BOD₅ to COD indicates how biodegradable a waste is; municipal sewage usually has a ratio around 0.4 to 0.6, while some industrial wastes have much lower ratios and need special treatment. Total organic carbon (TOC), measured by instruments that convert carbon to carbon dioxide, is a faster alternative often used in drinking water plants.
Nutrients
Nitrogen and phosphorus are the nutrients that most often limit the growth of algae and aquatic plants. In excess they cause eutrophication: dense algal blooms, murky water, oxygen depletion when the algae die and decay, and sometimes toxic cyanobacteria. Phosphorus usually limits growth in fresh water, which is why phosphorus removal is central to protecting lakes. Nitrogen matters in its own right: ammonia is toxic to fish, nitrification consumes oxygen, and nitrate in drinking water is a health concern. Lake Winnipeg and Lake Erie are well-known examples of large lakes harmed by nutrient runoff from cities and farms, with blooms visible from space in bad years.
Metals and other inorganic chemicals
Many inorganic chemicals occur naturally in groundwater because water dissolves minerals from rock. Arsenic, manganese, iron, uranium, fluoride and selenium are common examples on the prairies. Others come from human activity: lead from old service lines and solder, copper from household plumbing, chromium from industry, and road salt chloride. Iron and manganese cause the staining and metallic taste that residents of the farming town reported; manganese at higher concentrations is also a health concern for infants.
Organic chemicals
Synthetic organic chemicals include pesticides, solvents such as trichloroethylene and benzene, petroleum hydrocarbons, PCBs and PFAS. Some are present in raw water; others, called disinfection by-products, form during treatment when chlorine reacts with natural organic matter. The two main groups of regulated by-products are trihalomethanes (THMs) and haloacetic acids (HAAs). Minimizing them without weakening disinfection is a central challenge of drinking water treatment (lesson 7).
Microbiological quality
The greatest risk in drinking water is still microbial. Pathogens include bacteria such as E. coli O157:H7 and Campylobacter, viruses such as norovirus and hepatitis A, and protozoa such as Giardia and Cryptosporidium, whose tough cysts and oocysts resist chlorine. Testing for every pathogen is impractical, so laboratories test for indicator organisms. Total coliforms are a broad group of bacteria; their presence in treated water shows that treatment or the distribution system has been compromised. E. coli lives in the intestines of warm-blooded animals, and its presence is direct evidence of recent faecal contamination. Both should be absent in any 100 mL sample of treated drinking water.
How drinking water is regulated
In Canada, Health Canada and a federal-provincial-territorial committee develop the Guidelines for Canadian Drinking Water Quality. Most guidelines are maximum acceptable concentrations (MACs) based on health; others are aesthetic objectives (AOs) for taste, odour and appearance. The guidelines become enforceable when provinces and territories adopt them in their own regulations, which most do for regulated public systems. In 2024 Health Canada introduced an objective of 30 ng/L for the sum of 25 PFAS, based on what common treatment can achieve while the health science develops.
| Parameter | Guideline | Type | Main concern |
|---|---|---|---|
| E. coli | None detectable per 100 mL | MAC | Faecal contamination |
| Total coliforms | None detectable per 100 mL | MAC | Treatment or distribution failure |
| Nitrate | 45 mg/L as NO₃⁻ (10 mg/L as N) | MAC | Infant methemoglobinemia |
| Arsenic | 0.010 mg/L | MAC | Cancer |
| Lead | 0.005 mg/L | MAC | Neurodevelopment |
| Manganese | 0.12 mg/L (AO 0.02 mg/L) | MAC and AO | Infant neurodevelopment; staining |
| Uranium | 0.02 mg/L | MAC | Kidney effects |
| Fluoride | 1.5 mg/L | MAC | Dental fluorosis |
| Total trihalomethanes | 0.100 mg/L | MAC | Disinfection by-product |
| Sum of 25 PFAS | 30 ng/L | Objective | Persistent chemicals |
Lead deserves special mention. Health Canada lowered its lead guideline to 0.005 mg/L in 2019 and recommends sampling at the tap, because lead comes mainly from service lines, solder and fixtures inside buildings rather than from the treatment plant. Many cities now run programs to replace lead service lines.
Reviewing a water analysis
Joy's analysis of the farming town's main well is below. Nadia compares each result with the applicable values and flags anything that needs action.
# Compare a well analysis with selected Canadian guidelines (mg/L unless noted)
guide = {                     # parameter: (limit, type)
    "Nitrate (as NO3)": (45.0, "MAC"),
    "Arsenic":          (0.010, "MAC"),
    "Manganese":        (0.12, "MAC"),
    "Manganese (AO)":   (0.02, "AO"),
    "Iron (AO)":        (0.3, "AO"),
    "Uranium":          (0.02, "MAC"),
    "Fluoride":         (1.5, "MAC"),
}
well = {"Nitrate (as NO3)": 41.5, "Arsenic": 0.004, "Manganese": 0.31,
        "Manganese (AO)": 0.31, "Iron (AO)": 0.85, "Uranium": 0.006, "Fluoride": 0.4}
for p, (lim, kind) in guide.items():
    v = well[p]
    flag = "EXCEEDS" if v > lim else ("near limit" if v > 0.8 * lim else "ok")
print(f"{p:18s} {v:7.3f} limit {lim:6.3f} ({kind:3s}) {flag}")Nitrate (as NO3) 41.500 limit 45.000 (MAC) near limit Arsenic 0.004 limit 0.010 (MAC) ok Manganese 0.310 limit 0.120 (MAC) EXCEEDS Manganese (AO) 0.310 limit 0.020 (AO ) EXCEEDS Iron (AO) 0.850 limit 0.300 (AO ) EXCEEDS Uranium 0.006 limit 0.020 (MAC) ok Fluoride 0.400 limit 1.500 (MAC) ok
The screen shows three problems. Manganese, at 0.31 mg/L, exceeds both the health-based MAC and the aesthetic objective, and iron exceeds its aesthetic objective; together they explain the staining and taste. Nitrate, at 41.5 mg/L as nitrate, is below the MAC but close enough that seasonal peaks after spring fertilizing may exceed it. Arsenic, uranium and fluoride are acceptable. Nadia recommends monthly nitrate sampling, a study of well depth and land use in the capture zone, and treatment for iron and manganese, which can be removed by oxidation and filtration.
Source water protection, the first barrier in the multi-barrier approach, is often the cheapest long-term answer for nitrate. Working with farmers to adjust fertilizer timing in the well capture zone, sealing abandoned wells and drilling deeper may avoid the cost of nitrate removal by ion exchange or reverse osmosis.
Good decisions depend on good samples. Water quality results can be wrong because of how a sample was collected long before it reaches the laboratory. Bacteria samples go in sterile bottles with a chemical to neutralize chlorine and must reach the laboratory within about a day, on ice. Metals samples are preserved with acid; nitrate and BOD samples are kept cold and analysed quickly. Taps are flushed before sampling for most parameters, but not for lead, where the first water drawn after a stagnation period shows the worst case. Field blanks, duplicates and accredited laboratories make up the quality assurance program that lets an engineer trust the numbers.
Common mistakes
MistakeComparing a BOD₅ with an ultimate BOD limit.
InsteadCheck which BOD is specified; L₀ is larger than BOD₅ by a factor of about 1.5 for municipal sewage.
MistakeTreating a sample with no E. coli as proof the water is safe.
InsteadProtozoa and viruses can be present without E. coli; safety relies on treatment and the multi-barrier approach.
MistakeReading aesthetic objectives or secondary standards as health limits.
InsteadThey address taste, odour and appearance, though some, like manganese, also have health-based values.
MistakeChoosing a BOD dilution that uses up all the oxygen.
InsteadThe test needs at least 2 mg/L consumed and at least 1 mg/L remaining.
Summary and key terms
- Physical parameters include turbidity, solids, temperature, colour, taste and odour.
- Saturation DO falls with temperature, from about 14.6 mg/L at 0 °C to 9.1 mg/L at 20 °C.
- BOD₅ = (D₁ − D₂)/P; BOD_t = L₀(1 − e^(−kt)); COD is always larger than BOD.
- Nitrogen and phosphorus cause eutrophication; phosphorus usually limits freshwater algae.
- Total coliforms and E. coli are indicators; E. coli shows faecal contamination.
- Canadian guidelines set MACs and aesthetic objectives that provinces make enforceable; the 2024 PFAS objective is 30 ng/L for 25 PFAS.
- Turbidity
- Cloudiness of water caused by suspended particles, measured in NTU.
- Biochemical oxygen demand
- The oxygen consumed by bacteria oxidizing organic matter in a sample at 20 °C.
- Ultimate BOD
- The total oxygen demand exerted when the biodegradable organic matter is fully oxidized.
- Chemical oxygen demand
- The oxygen equivalent of organic matter oxidized by a strong chemical oxidant.
- Eutrophication
- Excessive growth of algae and plants caused by nutrient enrichment.
- Indicator organism
- An organism whose presence signals possible contamination by pathogens.
- Disinfection by-product
- A chemical formed when disinfectants react with substances in water.
- Maximum acceptable concentration
- A health-based limit in the Guidelines for Canadian Drinking Water Quality.
- Maximum contaminant level
- An enforceable limit under the US Safe Drinking Water Act.
Practice problems
Work each problem on paper first, then reveal the answer to check.
A BOD bottle contains 15 mL of effluent in 300 mL. The DO falls from 8.8 to 5.2 mg/L in five days. Find the BOD₅.
Show answer
\(P = 0.05\); \((8.8 - 5.2)/0.05 = 72\) mg/L.
If that effluent's k is 0.20 per day, what is its ultimate BOD?
Show answer
\(72/(1 - e^{-1.0}) = 72/0.632 = 114\) mg/L.
Convert 12 mg/L of nitrate-nitrogen to nitrate and compare with 45 mg/L as nitrate.
Show answer
\(12 \times 4.43 = 53\) mg/L as nitrate, which exceeds 45 mg/L.
Why are Cryptosporidium and Giardia a particular problem for chlorinated systems?
Show answer
Their cysts and oocysts resist chlorine, so filtration or UV light is needed to remove or inactivate them.
Why is phosphorus the main target for protecting freshwater lakes?
Show answer
It is usually the nutrient that limits algal growth in fresh water, so reducing it controls blooms.
Why is COD always greater than or equal to BOD for the same sample?
Show answer
The chemical oxidant oxidizes almost all organic matter, including material bacteria cannot degrade in five days.
Lesson quiz · 5 questions
Score 60% or more to complete this lesson.
Create a free account to save your progress, take quizzes and earn a certificate.