
CIV-280 · Lesson 3 of 12 · 25 min
Mass balances and reactors
Matter is neither created nor destroyed. That simple law of conservation of mass is the most powerful tool an environmental engineer has. Draw a boundary around anything, whether a lake, a treatment tank, a city's air or a landfill, and the mass of a substance inside can change only because the substance flows in, flows out, is produced or is consumed by reactions inside. Writing that statement as an equation, a mass balance, lets engineers predict concentrations in rivers below outfalls, size treatment tanks, estimate how fast a polluted lake will clean itself and check whether laboratory data make sense. This lesson develops the general mass balance, applies it to mixing problems and to lakes, and introduces the two ideal reactors, the completely mixed flow reactor and the plug flow reactor, that are used to model everything from treatment basins to rivers.
The general mass balance
Choose a control volume, a region of space with a clearly defined boundary. For any substance, the rate at which its mass inside the control volume changes equals the rate of mass flowing in, minus the rate flowing out, plus the rate of production by reactions inside, minus the rate of consumption by reactions inside:
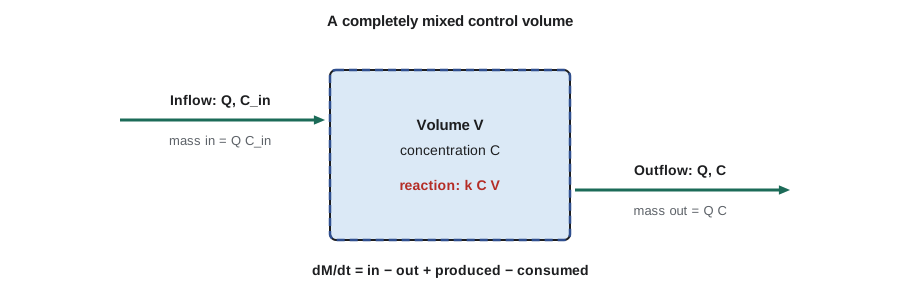
The flow terms are flow times concentration, as in lesson 1. The reaction terms are written per unit volume and multiplied by the volume. A substance that does not react, such as chloride or a dye tracer, is called conservative; for it, the reaction terms are zero. A substance that decays, such as biodegradable organic matter, bacteria or a radioactive isotope, is non-conservative.
Most problems simplify in one of two ways. At steady state, nothing changes with time, so dM/dt is zero and the inflows balance the outflows and reactions. Many design calculations assume steady state using average flows and loads. For time-varying problems, such as a spill or a change in a discharge, the full equation is solved as a differential equation.
Steady-state mixing
The simplest mass balance is the mixing of two streams with no reaction, such as an effluent entering a river. If the river and the effluent mix completely at the junction, the flow downstream is the sum of the two flows and the downstream concentration is the flow-weighted average:
Worked problem
Phosphorus below the outfall
During a dry autumn, the Assiniboine River upstream of the Brandon plant flows at 14.0 m³/s with 0.08 mg/L of total phosphorus. The plant discharges 0.42 m³/s of effluent at 3.5 mg/L. Assuming complete mixing, what is the concentration just downstream?
Show solution
- \[C_{\text{mix}} = \frac{14.0 \times 0.08 + 0.42 \times 3.5}{14.0 + 0.42}\]
- \[C_{\text{mix}} = \frac{1.12 + 1.47}{14.42} = 0.180\ \text{mg/L}\]
Answer: The downstream concentration is about 0.18 mg/L, more than double the upstream value. If the province's or state's nutrient objective for the river is around 0.10 mg/L, the plant would need to cut its effluent phosphorus sharply in low-flow seasons. Engineers check mixing at low flow because that is when dilution is least.
Complete mixing at the outfall is an idealization. In reality, an effluent plume hugs one bank and may travel kilometres before it spreads across a wide river. Permits often define a mixing zone, a limited area near the outfall where water quality objectives may be exceeded, and require the objectives to be met at its edge. Diffusers, pipes with many ports across the riverbed, speed up mixing.
The completely mixed flow reactor
An ideal completely mixed flow reactor (CMFR), also called a continuously stirred tank reactor, is perfectly mixed: the concentration is the same everywhere inside, and the outflow has the same concentration as the contents. Well-stirred tanks and many lakes and ponds behave approximately this way. The key parameter is the hydraulic residence time, the average time water spends inside:
For a substance that decays by a first-order reaction, where the rate of loss is proportional to the concentration (rate = kC, lesson 4), the steady-state mass balance on a CMFR is 0 = QC_in − QC − kCV. Solving for the outlet concentration gives:
Worked problem
A pesticide in a small lake
An invented reservoir, Willow Lake, has a volume of 2.0 × 10⁶ m³ and is fed by a creek flowing at 0.50 m³/s that carries 8.0 mg/L of a herbicide washed from fields. The herbicide breaks down in the lake with a first-order rate constant of 0.10 per day. Treating the lake as a CMFR at steady state, find the residence time and the herbicide concentration in the lake and its outflow.
Show solution
- \[Q = 0.50 \times 86\,400 = 43\,200\ \text{m}^3/\text{d}\]
- \[\tau = \frac{2.0 \times 10^6}{43\,200} = 46.3\ \text{d}\]
- \[C = \frac{8.0}{1 + 0.10 \times 46.3} = \frac{8.0}{5.63} = 1.42\ \text{mg/L}\]
Answer: The lake holds water for about 46 days, long enough for decay to remove about 82 per cent of the herbicide. If the herbicide did not decay, the lake would eventually reach the inflow concentration of 8.0 mg/L.
When things change: the transient CMFR
Suppose the creek suddenly begins carrying herbicide into a lake that had none. The mass balance is then a first-order differential equation, V dC/dt = QC_in − QC − kCV, and its solution starting from zero is:
Here C∞ is the steady-state value found above. The concentration approaches steady state exponentially, reaching about 95 per cent of it after three time constants, where one time constant is 1/(1/τ + k). For Willow Lake, 1/τ + k = 0.0216 + 0.10 = 0.122 per day, so the lake would reach 95 per cent of its steady value in about 3/0.122 = 25 days. When the source stops, the concentration falls with the same exponential rate. A lake with a long residence time and slow decay takes years to recover after a pollutant is removed, a hard lesson learned on many lakes polluted by phosphorus or mercury.
# Willow Lake: herbicide concentration after the creek starts carrying it
import math
V = 2.0e6               # lake volume, m3
Q = 0.50 * 86400        # inflow, m3/d
Cin = 8.0               # herbicide in creek, mg/L
k = 0.10                # first-order decay, 1/d
tau = V / Q
Css = Cin / (1 + k * tau)
rate = 1 / tau + k      # 1/d
print(f"tau = {tau:.1f} d, steady state = {Css:.2f} mg/L")
for t in (0, 5, 10, 20, 30, 50):
    C = Css * (1 - math.exp(-rate * t))
print(f"day {t:3d}: C = {C:.2f} mg/L ({100 * C / Css:.0f}% of steady state)")tau = 46.3 d, steady state = 1.42 mg/L day 0: C = 0.00 mg/L (0% of steady state) day 5: C = 0.65 mg/L (46% of steady state) day 10: C = 1.00 mg/L (70% of steady state) day 20: C = 1.30 mg/L (91% of steady state) day 30: C = 1.38 mg/L (97% of steady state) day 50: C = 1.42 mg/L (100% of steady state)
The plug flow reactor
In an ideal plug flow reactor (PFR), fluid moves through a long channel or pipe as a series of plugs that do not mix with the plugs ahead or behind. Each plug behaves like a small batch reactor travelling through the system, so a parcel of water spends exactly the residence time τ inside. Long, narrow basins, pipelines and some rivers approximate plug flow. For a first-order reaction, the outlet concentration is:
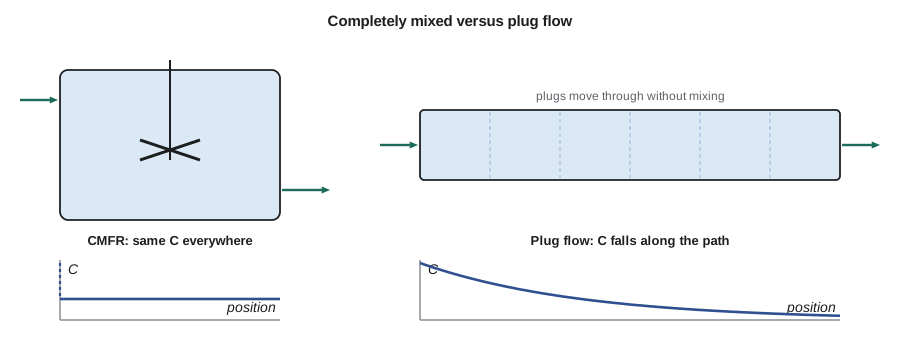
For the same volume and flow, a plug flow reactor removes more of a substance that decays by first-order reaction than a CMFR does. The reason is that a CMFR immediately dilutes the incoming water down to the low outlet concentration, so the reaction runs at its slowest rate everywhere, while in a plug flow reactor the reaction runs fast near the inlet where concentrations are high.
Worked problem
CMFR or plug flow for a disinfection contact tank
A contaminant is destroyed by a first-order reaction with k = 0.50 per hour. Compare the fraction remaining after a 4.0-hour residence time in (a) one CMFR, (b) a plug flow reactor and (c) three equal CMFRs in series with the same total volume.
Show solution
- \[\text{(a) CMFR: } \frac{C}{C_{\text{in}}} = \frac{1}{1 + 0.50 \times 4.0} = 0.333\]
- \[\text{(b) PFR: } \frac{C}{C_{\text{in}}} = e^{-0.50 \times 4.0} = 0.135\]
- \[\text{(c) three CMFRs: } \frac{C}{C_{\text{in}}} = \left(\frac{1}{1 + 0.50 \times 4.0/3}\right)^3 = 0.216\]
Answer: One CMFR leaves 33 per cent of the contaminant, plug flow only 13.5 per cent, and three tanks in series fall in between at 21.6 per cent. This is why chlorine contact tanks in water treatment are built with baffles that make the flow snake back and forth, approaching plug flow.
Real reactors lie between the two ideals. Dead zones, short-circuiting and back-mixing make a tank behave differently from its design. Engineers measure the actual behaviour with a tracer test: a pulse of a conservative dye or salt is added at the inlet and its concentration is recorded at the outlet. The shape of the resulting curve shows how close the tank is to plug flow, and the time at which 10 per cent of the tracer has passed, called T10, is used to give credit for disinfection (lesson 7).
Mass balances as a check on data
Mass balances are also an auditing tool. If a treatment plant reports that 150 kg/d of phosphorus enters, 15 kg/d leaves in the effluent and only 60 kg/d leaves in the sludge, then 75 kg/d is unaccounted for, which suggests a sampling problem, a flow meter error or a mistake in the sludge data. Joy checks every set of plant data this way before Nadia uses it for design. Mass balances on water itself, comparing metered inflows with billed consumption, are how utilities find leaks in distribution systems.
Mass balances also apply to whole regions. Air quality agencies build emission inventories by adding up the mass of each pollutant released by every source in an airshed. Watershed managers compare the phosphorus delivered by farms, towns and the atmosphere with the mass leaving at the river mouth. In each case the same equation, in minus out plus production minus consumption, organizes the problem.
Choosing the control volume well is half the work. A good boundary cuts through places where flows and concentrations are known or can be measured, such as pipes, channels and stacks, and encloses the process of interest. Nadia draws a box around the whole treatment plant to check the plant's phosphorus data, a smaller box around one clarifier to size it, and a box around a reach of river to study an outfall. The same physical system can be analysed with many control volumes, and comparing them is often how errors are found.
Common mistakes
MistakeAveraging concentrations without weighting by flow.
InsteadMixed concentration is the flow-weighted average: add the loads and divide by the total flow.
MistakeUsing the plug flow equation for a well-mixed lake.
InsteadA completely mixed lake follows C = C_in/(1 + kτ), not the exponential.
MistakeForgetting to convert flows and rate constants to consistent time units.
InsteadIf k is per day, the flow must be in volume per day.
MistakeAssuming the outfall mixes completely right away.
InsteadPlumes may hug a bank for long distances; check mixing zones and use low design flows.
Summary and key terms
- A mass balance states that accumulation = in − out + production − consumption for any control volume.
- At steady state, accumulation is zero; for mixing with no reaction, the result is a flow-weighted average.
- Residence time is τ = V/Q.
- A CMFR at steady state with first-order decay gives C = C_in/(1 + kτ); after a step change it approaches steady state exponentially.
- A plug flow reactor gives C = C_in e^(−kτ) and removes more than a CMFR of the same size; tanks in series lie between.
- Mass balances check data, find leaks and organize emission and watershed inventories.
- Control volume
- A region with a defined boundary used to write a mass balance.
- Conservative substance
- A substance that does not react or decay, such as chloride.
- Steady state
- A condition in which nothing changes with time.
- Hydraulic residence time
- The average time water spends in a reactor, equal to volume divided by flow.
- Completely mixed flow reactor
- An idealized reactor whose contents have the same concentration everywhere, equal to the outlet concentration.
- Plug flow reactor
- An idealized reactor in which fluid moves as plugs that do not mix with one another.
- Mixing zone
- A limited area near an outfall where water quality objectives may be exceeded.
- Tracer test
- A test in which a conservative substance is added to measure how water actually moves through a reactor.
Practice problems
Work each problem on paper first, then reveal the answer to check.
A creek at 0.8 m³/s with 12 mg/L of chloride joins a river at 6.0 m³/s with 20 mg/L. Find the mixed chloride concentration.
Show answer
\((0.8 \times 12 + 6.0 \times 20)/6.8 = 19.1\) mg/L.
A tank holds 500 m³ and receives 2,000 m³/d. What is its residence time in hours?
Show answer
\(500/2000 = 0.25\) d = 6 h.
A CMFR has τ = 8 h and a first-order rate constant of 0.25 per hour. What fraction of the substance remains?
Show answer
\(1/(1 + 2) = 0.333\), one third.
Repeat the previous question for a plug flow reactor.
Show answer
\(e^{-2} = 0.135\).
Why does a long, baffled basin outperform a single stirred tank of the same volume for a first-order reaction?
Show answer
It approaches plug flow, so the reaction proceeds at high concentrations near the inlet instead of at the low outlet concentration everywhere.
A plant reports 120 kg/d of nitrogen in, 18 kg/d in the effluent and 30 kg/d in the sludge. What might account for the rest?
Show answer
Nitrogen gas lost to the air by denitrification is a real sink; if denitrification is not expected, the gap suggests sampling or flow errors.
Lesson quiz · 5 questions
Score 60% or more to complete this lesson.
Create a free account to save your progress, take quizzes and earn a certificate.