
BUS-110 · Lesson 12 of 12 · 42 min
Statistics, spreadsheets and capstone: a small-business calculation pack
The earlier lessons each focused on one kind of calculation. Real business problems mix them: a decision about a new truck involves a loan, payroll, pricing, sales tax, break-even and an investment appraisal, all resting on sales data that has to be summarized and forecast. This final lesson adds the descriptive statistics and index numbers that business people use to summarize data, sets out good spreadsheet practice for building reliable calculations, and then works through a capstone case that pulls the whole course together.
Summarizing business data
A list of numbers, such as a year of monthly sales, means little until it is summarized. Measures of centre describe a typical value; measures of spread describe how much the values vary.
| Measure | How to calculate | Spreadsheet function | Best used for |
|---|---|---|---|
| Mean (average) | Sum of values ÷ number of values | AVERAGE | Symmetric data without extreme values |
| Median | Middle value when sorted (average of the two middle values if even) | MEDIAN | Skewed data, such as incomes or house prices |
| Mode | Most frequent value | MODE.SNGL | Categories or sizes, such as the most common order |
| Weighted mean | Σ(value × weight) ÷ Σ weights | SUMPRODUCT ÷ SUM | Averages across groups of different sizes |
| Range | Largest − smallest | MAX − MIN | A quick sense of spread |
| Standard deviation | Square root of the average squared deviation from the mean | STDEV.S (sample) or STDEV.P | Measuring variability and risk |
The sample standard deviation divides the sum of squared deviations by n − 1 rather than n, which corrects for the tendency of a sample to understate the variability of the whole population.
Worked problem
Summarizing monthly sales
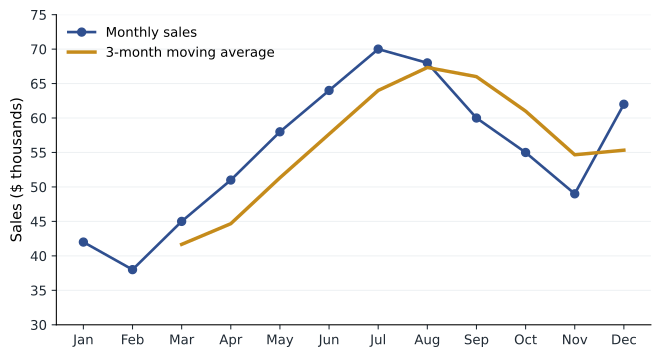
A gift shop recorded monthly sales (in thousands of dollars) from January to December of 42, 38, 45, 51, 58, 64, 70, 68, 60, 55, 49 and 62. Find the mean, median, range and sample standard deviation.
Show solution
- Sum = 662; mean = 662 ÷ 12 = 55.17, or about $55,170 a month.
- Sorted: 38, 42, 45, 49, 51, 55, 58, 60, 62, 64, 68, 70. Median = (55 + 58) ÷ 2 = 56.5.
- Range = 70 − 38 = 32.
- Sum of squared deviations from the mean ≈ 1,167.67. s = √(1,167.67 ÷ 11) = √106.15 ≈ 10.30.
Answer: Average monthly sales were about $55,200 (median $56,500), varying from $38,000 to $70,000 with a standard deviation of about $10,300.
Worked problem
A weighted mean
A café sells three sizes of coffee: small at $3.50 (40 % of cups), medium at $4.25 (35 %) and large at $5.00 (25 %). What is the average price per cup? Would the simple average of the three prices be correct?
Show solution
- Weighted mean = 0.40 × $3.50 + 0.35 × $4.25 + 0.25 × $5.00 = $1.40 + $1.4875 + $1.25 = $4.14.
- Simple average = ($3.50 + $4.25 + $5.00) ÷ 3 = $4.25, which ignores that small cups sell most.
Answer: The average price is about $4.14 a cup. The simple average of $4.25 would overstate revenue by about 2.7 %.
Moving averages and simple forecasts
Monthly figures bounce around because of seasons, weather, holidays and chance. A moving average smooths them by averaging the latest few periods, which makes the underlying trend easier to see. A 3-month moving average for March is the average of January, February and March; for April it drops January and adds April, and so on. The most recent moving average is a simple forecast for the next month, though it lags behind a strong trend and ignores seasonality.
Worked problem
A 3-month moving average
Using the gift shop's sales, calculate the 3-month moving averages for March, July and December, and use December's to forecast January.
Show solution
- March: (42 + 38 + 45) ÷ 3 = 41.67.
- July: (58 + 64 + 70) ÷ 3 = 64.00.
- December: (55 + 49 + 62) ÷ 3 = 55.33.
- Forecast for January = 55.33, or about $55,300.
Answer: The moving average forecasts January sales of about $55,300. Because last January was only $42,000, a seasonal adjustment would probably give a lower and better forecast.
Index numbers and inflation
An index number expresses a value as a percentage of its value in a base period, which is set to 100. The best-known example is the Consumer Price Index (CPI), which tracks the cost of a fixed basket of goods and services bought by households. The percentage change in the CPI over a year is the inflation rate.
In Canada, Statistics Canada publishes the CPI every month, with 2002 = 100 as the base. The Bank of Canada aims to keep CPI inflation at 2 %, the midpoint of a 1 % to 3 % target range. The CPI is used to index many payments, including CPP and Old Age Security benefits and federal tax brackets.
Worked problem
Comparing salaries across time
An employee earned $52,000 in 2016. Using illustrative CPI values of 128.4 for 2016 and 165.0 for 2026, what salary in 2026 would have the same purchasing power?
Show solution
- Equivalent salary = $52,000 × 165.0 ÷ 128.4 = $66,822.43.
- Cumulative inflation = 165.0 ÷ 128.4 − 1 = 28.5 %.
Answer: A 2026 salary of about $66,822 matches the purchasing power of $52,000 in 2016. An employee earning less than this in 2026 has had a real pay cut.
Worked problem
Real sales growth
A business's sales grew from $410,000 in 2021 to $520,000 in 2026. Using illustrative CPI values of 141.6 for 2021 and 165.0 for 2026, how much did sales grow in real terms?
Show solution
- Nominal growth = $520,000 ÷ $410,000 − 1 = 26.8 %.
- 2026 sales in 2021 dollars = $520,000 × 141.6 ÷ 165.0 = $446,254.55.
- Real growth = $446,254.55 ÷ $410,000 − 1 = 8.8 %.
Answer: Sales grew 26.8 % in dollars but only 8.8 % in real terms; most of the apparent growth was inflation.
Building reliable spreadsheets
Most business calculations end up in a spreadsheet, and spreadsheet errors are common and sometimes very costly. A few habits make spreadsheets far more reliable.
- Separate inputs, calculations and outputs. Put every assumption, such as rates, prices and costs, in clearly labelled input cells, and refer to them in formulas rather than typing numbers into formulas.
- Use absolute references (such as $B$2) for inputs that every row should use, and relative references for values that change row by row.
- Round only where money changes hands, such as each payment or each tax amount, with ROUND(value, 2); keep full precision in intermediate steps.
- Add checks: totals that should agree, balances that should end at zero, percentages that should sum to 100 %. Flag any check that fails.
- Label units (dollars, per cent, months), date-stamp rates that change, such as tax rates, and note the source of each assumption.
- Test with a case you can work by hand, then try extreme inputs to see whether results stay sensible.
| Task | Function | Example |
|---|---|---|
| Loan or annuity payment | PMT(rate, nper, pv, [fv], [type]) | =PMT(0.084/12, 60, −75000) → 1,535.13 |
| Future value | FV(rate, nper, pmt, [pv], [type]) | =FV(0.005, 300, −300) → 207,898.19 |
| Present value | PV(rate, nper, pmt, [fv], [type]) | =PV(0.006, 60, −2500) → 125,655.33 |
| Number of periods | NPER(rate, pmt, pv, [fv], [type]) | =NPER(0.00375, −3500, 500000) → 204.98 |
| Rate per period | RATE(nper, pmt, pv, [fv], [type]) | =RATE(16, 25, −1080, 1000) → 1.91 % a half-year |
| Net present value | NPV(rate, values) + initial flow | =NPV(0.10, B2:B6) + B1 |
| Internal rate of return | IRR(values) | =IRR(B1:B6) → 20.37 % |
| Days between dates | end − start, or DAYS(end, start) | =DAYS("2026-08-09", "2026-03-15") → 147 |
Capstone: a food truck business
Amira plans to start a food truck selling lunch bowls in a mid-sized Canadian city. She has $20,000 saved and wants to know whether the business is viable. All amounts below are before sales tax: the HST or GST and PST she collects on meals belongs to the government, is remitted regularly and is not revenue. Each step uses a technique from an earlier lesson.
Worked problem
Step 1: financing the truck (lessons 8 and 9)
A fitted truck costs $95,000. Amira puts down $20,000 and borrows the rest at 8.4 % compounded monthly over 5 years. What is the monthly payment?
Show solution
- Loan = $95,000 − $20,000 = $75,000; i = 0.084 ÷ 12 = 0.007; n = 60.
- PMT = $75,000 × 0.007 ÷ (1 − 1.007^−60) = $1,535.13.
Answer: The loan payment is $1,535.13 a month.
Worked problem
Step 2: pricing (lesson 5)
Ingredients and packaging for a bowl cost $4.20. Amira wants a food cost of 35 % of the selling price, a common target in food service. What price should she charge, and what is the contribution margin?
Show solution
- If cost is 35 % of price, price = $4.20 ÷ 0.35 = $12.00.
- Markup on cost = $7.80 ÷ $4.20 = 185.7 %; margin on price = 65 %.
- Contribution margin = $12.00 − $4.20 = $7.80 a bowl.
Answer: A price of $12.00 gives a contribution margin of $7.80 a bowl.
Worked problem
Step 3: monthly fixed costs, including payroll (lesson 3)
Fixed monthly costs are the loan payment, insurance of $450, commissary kitchen rent of $1,200, permits of $300, fuel and propane of about $900, one employee working 120 hours at $20 an hour with employer payroll costs of about 8 % on top, and a salary of $4,000 a month for Amira herself. What are total fixed costs?
Show solution
- Employee cost = 120 × $20 × 1.08 = $2,592.00.
- Fixed costs = $1,535.13 + $450 + $1,200 + $300 + $900 + $2,592 + $4,000 = $10,977.13 a month.
Answer: Fixed costs are about $10,977 a month. Treating fuel and staff as fixed is a simplification; they would rise with longer operating hours.
Worked problem
Step 4: break-even and risk (lesson 11)
What is the break-even volume? If Amira expects to sell 1,600 bowls a month, what are her expected profit, margin of safety and degree of operating leverage?
Show solution
- Break-even = $10,977.13 ÷ $7.80 = 1,407.3, so 1,408 bowls a month (about 67 a day over 21 working days).
- Profit at 1,600 = 1,600 × $7.80 − $10,977.13 = $12,480 − $10,977.13 = $1,502.87.
- Margin of safety = (1,600 − 1,407.3) ÷ 1,600 = 12.0 %.
- DOL = $12,480 ÷ $1,502.87 = 8.3.
Answer: The business covers its costs, including Amira's salary, at about 1,408 bowls a month. At 1,600 bowls it makes $1,503 of profit, but the margin of safety is only 12 % and each 1 % change in sales moves profit by over 8 %. The plan is viable but sensitive to sales.
Worked problem
Step 5: is the investment worthwhile? (lesson 10)
Before financing costs, the truck generates operating cash flow of 12 × (1,600 × $7.80 − fixed costs excluding the loan payment) each year. Amira expects to sell the truck for $30,000 after 5 years. She requires a 12 % return. What are the NPV and IRR of the $95,000 investment?
Show solution
- Fixed costs excluding the loan payment = $10,977.13 − $1,535.13 = $9,442.00.
- Annual operating cash flow = 12 × ($12,480 − $9,442) = $36,456.
- PV of 5 years of cash flow at 12 % = $36,456 × (1 − 1.12^−5) ÷ 0.12 = $131,415.72.
- PV of the $30,000 resale = $30,000 ÷ 1.12^5 = $17,022.81.
- NPV = −$95,000 + $131,415.72 + $17,022.81 = $53,438.53. A spreadsheet IRR gives about 30.9 %.
Answer: At 1,600 bowls a month the truck has an NPV of about $53,400 and an IRR of about 31 %, well above the 12 % required return, after paying Amira a salary. Because profit is so sensitive to volume, she should also run the numbers at 1,400 and 1,800 bowls before committing.
# Capstone: food truck calculation pack
import statistics as st
sales = [42, 38, 45, 51, 58, 64, 70, 68, 60, 55, 49, 62]
print(f"mean {st.mean(sales):.2f}, median {st.median(sales)}, stdev {st.stdev(sales):.2f}")
print("3-month moving averages:", [round(sum(sales[k - 2:k + 1]) / 3, 2) for k in range(2, 12)])

i = 0.084 / 12
loan_pmt = round(75000 * i / (1 - (1 + i) ** -60), 2)
price, vc = 12.00, 4.20
cm = price - vc
fixed = loan_pmt + 450 + 1200 + 300 + 900 + 120 * 20 * 1.08 + 4000
be = fixed / cm
for q in (1400, 1600, 1800):
    profit = q * cm - fixed
    ocf = 12 * (q * cm - (fixed - loan_pmt))
    flows = [-95000] + [ocf] * 4 + [ocf + 30000]
    npv = sum(c / 1.12 ** t for t, c in enumerate(flows))
    print(f"{q} bowls: profit/month {profit:,.2f}, NPV at 12% {npv:,.2f}")
print(f"loan payment {loan_pmt}, fixed costs {fixed:,.2f}, break-even {be:,.1f} bowls")mean 55.17, median 56.5, stdev 10.30 3-month moving averages: [41.67, 44.67, 51.33, 57.67, 64.0, 67.33, 66.0, 61.0, 54.67, 55.33] 1400 bowls: profit/month -57.13, NPV at 12% -14,042.88 1600 bowls: profit/month 1,502.87, NPV at 12% 53,438.53 1800 bowls: profit/month 3,062.87, NPV at 12% 120,919.94 loan payment 1535.13, fixed costs 10,977.13, break-even 1,407.3 bowls
Common mistakes
MistakeUsing the simple average of prices or rates from groups of different sizes.
InsteadUse a weighted mean.
MistakeComparing dollar amounts from different years directly.
InsteadAdjust for inflation with a price index first.
MistakeTyping numbers directly into spreadsheet formulas.
InsteadPut assumptions in labelled input cells and refer to them.
MistakeTreating sales tax collected as revenue.
InsteadSales tax collected is owed to the government; exclude it from revenue and costs.
MistakeBasing a decision on a single forecast.
InsteadTest the result at lower and higher volumes, and other key assumptions.
Summary and key terms
- Mean, median and mode describe the centre; range and standard deviation describe the spread.
- Weighted means combine groups of different sizes correctly.
- Moving averages smooth fluctuations and give simple forecasts.
- Price indexes such as the CPI convert values between years and separate real from nominal growth.
- Reliable spreadsheets separate inputs, calculations and outputs and include checks.
- Business decisions combine financing, pricing, payroll, break-even and investment analysis.
- Sensitivity testing shows how much a decision depends on its assumptions.
- Mean
- The sum of values divided by their number.
- Median
- The middle value of sorted data.
- Mode
- The most frequent value.
- Weighted mean
- An average in which each value counts according to its weight.
- Standard deviation
- A measure of how far values typically lie from the mean.
- Moving average
- The average of the most recent fixed number of periods.
- Index number
- A value expressed relative to a base period set to 100.
- Consumer Price Index
- An index of the cost of a fixed basket of consumer goods and services.
- Real value
- A value adjusted for inflation.
- Sensitivity analysis
- Testing how results change when assumptions change.
Practice problems
Work each problem on paper first, then reveal the answer to check.
Find the mean and median of 12, 15, 9, 22 and 17.
Show answer
Mean 15; median 15.
Find the range of 12, 15, 9, 22 and 17.
Show answer
13.
Three products sell 40, 25 and 35 units with margins of $12, $15 and $9. What is the weighted average margin per unit?
Show answer
$11.70.
Sales for three months are 80, 92 and 86. What is the 3-month moving average?
Show answer
86.
A price index rises from 150 to 159. What is the inflation rate?
Show answer
6 %.
$40,000 in a year with CPI 120 is worth how much in a year with CPI 150?
Show answer
$50,000.
Nominal sales growth is 10 % and inflation 4 %. What is the real growth?
Show answer
About 5.77 %.
Which spreadsheet function gives the sample standard deviation?
Show answer
STDEV.S.
In the capstone, what happens to the break-even point if the bowl price rises to $12.50?
Show answer
It falls to about 1,323 bowls ($10,977.13 ÷ $8.30).
Why should sales tax be excluded from revenue in a break-even analysis?
Show answer
It is collected for the government and does not belong to the business.
Lesson quiz · 5 questions
Score 60% or more to complete this lesson.
Create a free account to save your progress, take quizzes and earn a certificate.