
AWS-112 · Lesson 11 of 12 · 18 min
Measuring business value from generative AI
▶ Video coming soon A video version of this lesson is on the way.
The board meeting was three weeks away, and the board had one question about generative AI that no amount of technical detail would answer: was it worth it? Lorraine Beaudry had seen too many technology projects declared successful because people liked them. "I want numbers we agree on before the pilot starts," she said at the eleventh AI hour, "not numbers we find afterwards."
Noor considered this the most important lesson of the course. Generative AI is easy to demonstrate and hard to evaluate, because a good demonstration feels like value. This lesson covers how to define business value for a generative AI application, the metrics the AWS Certified AI Practitioner exam guide names, how to set a baseline and run a fair pilot, how to account for the full cost, and how to read the results honestly.
Start from the business problem
Value is defined by the problem being solved, not by the technology. The overnight summaries exist because the morning team spends too long reading long, inconsistent notes at handover, and because important details in those notes are sometimes missed. That gives two kinds of value to measure: efficiency (time saved) and quality (fewer missed details and better follow-up). A website help assistant, by contrast, would be measured by how many routine questions it resolves and whether clients are satisfied. Different problems, different metrics.
Noor asked Jonah to write the value statement in one sentence before choosing any metric: "The morning team should finish overnight handover faster without missing more clinically important details, and callbacks owed to clients should not be forgotten." Every metric in the pilot traces back to a phrase in that sentence.
Metrics named in the exam guide
The exam guide lists business metrics for generative AI applications. Each fits some applications and not others.
| Metric | What it measures | Where it fits at Cascade Ridge |
|---|---|---|
| Efficiency | Time or effort saved per task | Minutes to read and act on overnight notes |
| Accuracy | How often outputs are correct by an agreed standard | Summaries with every key fact and no invented ones |
| Return on investment (ROI) | Net benefit relative to total cost | Value of time saved against the full cost of the system |
| Conversion rate | Share of interactions that end in a desired action | Website visitors who complete a booking after using the assistant |
| Average revenue per user (ARPU) | Revenue divided by the number of users or clients | Effect of a wellness-plan recommendation tool, if one were built |
| Customer lifetime value (CLV) | Total value of a client relationship over time | Whether better follow-up keeps clients with the practice longer |
| Cross-domain performance | How well the solution works across different tasks or areas | Whether one assistant serves clinics, pharmacy and front desk equally well |
Alongside business metrics, teams track operational metrics: cost per request, latency, error and refusal rates, and how often reviewers correct the output. And they track user satisfaction, because a tool that saves time but frustrates staff will not be used for long.
Set a baseline first
A baseline is a measurement of the current situation, taken before the change, using the same method that will be used afterwards. Without one, "the summaries save time" is an impression, not a finding. The team measured three things over two weeks of normal overnight work, with staff consent and without changing anything.
- Minutes the morning vet spent reading and acting on overnight notes, timed by the vet at handover.
- Callbacks owed to clients that were missed, counted from the callback log.
- Administrative minutes the overnight technician spent writing notes, from a short self-report each shift.
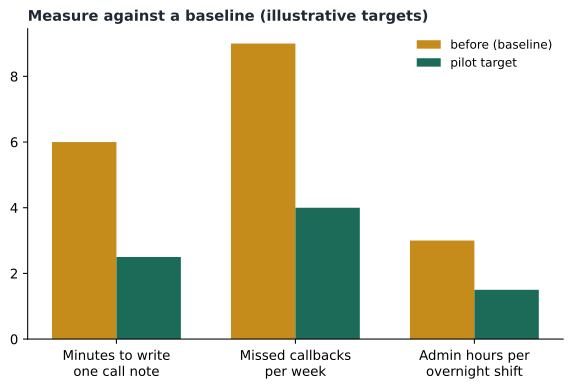
With the baseline in hand, Lorraine and Dr. Kaur agreed targets in advance: handover reading time reduced substantially, missed callbacks at least halved, and, as a guardrail metric, no increase in clinically important details missed, checked by a weekly audit of summaries against full notes. A guardrail metric is something that must not get worse; a pilot that saves time while missing more clinical details fails, whatever the time savings.
Design a fair pilot
A pilot tests the system in real work on a limited scale. Several design choices make its results trustworthy.
- Limited scope. One site, the emergency hospital, for a fixed period, with the old process available as a fallback.
- Same measurement method as the baseline. The same timing at handover, the same callback log, the same self-report.
- A comparison where possible. Running some nights with summaries and some without, or comparing with a similar period, separates the tool's effect from seasonal changes such as a quiet month.
- Agreed stop conditions. If an audit finds a summary that hid a clinically important fact which a vet then missed, the pilot pauses for review.
- Qualitative feedback. Short weekly comments from users explain the numbers and surface problems no metric captures.
Count the full cost
ROI needs the full cost, not just the model's per-token charges, which lesson 10 showed were small. Noor listed the costs Jonah had to include in the business case.
- Run costs: model tokens, batch processing, retrieval and guardrail charges, logging and storage.
- Build costs: staff and contractor time to design, build, test and integrate the tool.
- People costs: reviewer time spent checking summaries, training, and change management.
- Ongoing costs: monitoring, re-evaluating when models change, and maintaining prompts and documents.
- Risk costs: the effort of controls such as audits, and the potential cost of an error that slips through.
# Simple first-year ROI for the overnight summaries. All figures are ILLUSTRATIVE.
nights_per_year = 365
minutes_saved_per_night = 25          # vet reading time at handover (pilot target)
tech_minutes_saved_per_night = 60     # technician note-writing time
vet_cost_per_hour, tech_cost_per_hour = 90, 38   # loaded staff cost, illustrative

benefit = nights_per_year * (minutes_saved_per_night / 60 * vet_cost_per_hour
                             + tech_minutes_saved_per_night / 60 * tech_cost_per_hour)
costs = {"build and test": 18000, "model and AWS run": 600, "review audits": 3500, "maintenance": 4000}
total_cost = sum(costs.values())
roi = (benefit - total_cost) / total_cost
print(f"annual benefit: about {benefit:,.0f} USD")
print(f"first-year cost: about {total_cost:,.0f} USD")
print(f"first-year ROI: {roi:.2f} (net benefit per dollar spent)")annual benefit: about 27,558 USD first-year cost: about 26,100 USD first-year ROI: 0.06 (net benefit per dollar spent)
What this code does
It estimates the first-year return on investment for AI-written overnight summaries using illustrative figures. The benefit is the staff time saved each night, valued at hourly staff costs, over a year; the cost is the sum of building, running, auditing and maintaining the system. ROI is the net benefit divided by the cost, and here it is only slightly positive, so the project barely pays for itself in year one.
The numbers are illustrative, but the shape is typical. The model's run cost is the smallest line. Build effort and the people who keep the system safe dominate the first year. Lorraine also wanted to see the result without the technician savings, which were self-reported and less certain; the case still held, more modestly. Noor encouraged that kind of sensitivity check: if a business case collapses when one uncertain assumption is removed, it is not yet a strong case.
Reading the results honestly
When the pilot ends, the team compares the results with the targets agreed in advance. Three cautions help keep the reading honest.
- Novelty effects. People often use a new tool enthusiastically at first and less later, or work harder because they know they are being measured. A pilot long enough to settle helps.
- Moved work. Time saved writing notes may reappear as time spent correcting summaries. Measure the whole workflow, not one step.
- Averages hide failures. A good average accuracy can conceal rare but serious errors. That is why the clinical guardrail metric is reported separately and counts individual cases.
Value also includes things that are hard to price, such as staff fatigue on long overnight shifts. Those can be reported alongside the numbers, but Lorraine's rule stood: the decision rests on the measures agreed before the pilot.
# Comparing pilot results with targets agreed in advance. Illustrative results.
targets = {"handover minutes": ("<=", 20), "missed callbacks per week": ("<=", 4),
           "important details missed (audit)": ("<=", 0)}
results = {"handover minutes": 18, "missed callbacks per week": 5,
           "important details missed (audit)": 0}
for metric, (op, goal) in targets.items():
    met = results[metric] <= goal
print(f"{metric:34} result {results[metric]:3} target {op} {goal:3} {'met' if met else 'NOT met'}")handover minutes result 18 target <= 20 met missed callbacks per week result 5 target <= 4 NOT met important details missed (audit) result 0 target <= 0 met
What this code does
It compares a pilot's results with targets agreed before the pilot started, each of which must stay at or below a set value. For each measure it prints the result, the target and whether it was met. Two targets are met and missed callbacks are not, which tells the team exactly what to fix before going further.
In the illustrative results, two targets are met and one narrowly missed. The right response is neither celebration nor cancellation but investigation: the callback misses might come from summaries that bury the callback request, which a format change could fix. The pilot then continues, with the change, and is measured again.
Common mistakes
MistakeMeasuring value only after the pilot, with metrics chosen then.
InsteadAgree metrics, baselines and targets before the pilot starts.
MistakeCounting only model token costs in ROI.
InsteadInclude build, people, review, maintenance and risk costs.
MistakeReporting average accuracy alone.
InsteadReport serious errors separately as guardrail metrics; averages can hide them.
MistakeUsing conversion rate for an internal summarization tool.
InsteadChoose metrics that match the application: efficiency and accuracy for internal tools, conversion and revenue metrics for customer-facing sales tools.
Value beyond the first application
Some of the value of a first generative AI project comes from what it makes easier next time. The evaluation set, the de-identification process, the privacy review template, the guardrail settings and the cost monitoring built for the overnight summaries can all be reused for the procedure manual tool and the client assistant. Noor called these platform benefits. They are real, but they are also easy to exaggerate, so she suggested counting them only when a second project actually reuses them, and recording the time saved then.
There are also costs of not acting, which belong in an honest business case. Staff were already using public chatbots for work, as lesson 1 noted, and some of that use may have involved client information. Providing an approved tool with clear rules reduces that risk, even if the risk is hard to put a number on. Hannah asked for that point to be stated in the case as a qualitative benefit rather than buried in a calculation.
Presenting value to decision makers
Lorraine's advice for the board presentation was to show four things on one page: the problem and the value statement; the baseline and the agreed targets; the full first-year cost and the ROI with its main assumptions stated; and the risks with the controls that address them, including the guardrail metric and the stop condition. Details go in an appendix. Boards are rarely persuaded by technical sophistication, she said, and often persuaded by a clear statement of what will be measured, when, and what will happen if the results disappoint.
Noor added one item: a date for the decision. A pilot without a decision date tends to drift into permanent use without ever being judged. The overnight summaries pilot would be reviewed after a fixed number of weeks, with three possible outcomes agreed in advance: expand to more sites, continue with changes and measure again, or stop. Having "stop" on the list, she said, is what makes the other two outcomes believable.
For the exam, the key ideas are simpler than a board presentation. Know the metrics the guide lists and which kinds of application each suits: efficiency and accuracy for internal productivity tools; conversion rate, average revenue per user and customer lifetime value for customer-facing and sales tools; ROI for the investment decision as a whole; and cross-domain performance for solutions meant to serve many tasks or departments.
Worked problem
Choosing metrics
The marketing team proposes a website assistant that answers questions about the puppy wellness plan and links to sign-up. Which metrics best measure its value, and which guardrail metric matters?
Show solution
- The goal is more sign-ups and fewer routine questions to the front desk.
- Conversion rate: visitors who sign up after using the assistant, compared with a baseline period.
- Efficiency: routine plan questions reaching the front desk per week.
- Longer term: average revenue per client and customer lifetime value for plan members.
- Guardrail: answers checked for accuracy against the plan terms, and no clinical advice given.
Answer: Conversion rate, front-desk question volume and later revenue and lifetime value, with accuracy and no clinical advice as guardrails.
Summary and key terms
- Business value comes from the problem being solved, so start with a one-sentence value statement and choose metrics that trace back to it.
- The exam guide names efficiency, accuracy, ROI, conversion rate, average revenue per user, customer lifetime value and cross-domain performance; operational metrics and user satisfaction complete the picture.
- Measure a baseline with the same method you will use later, agree targets and guardrail metrics before the pilot, and run a limited pilot with fallbacks, comparisons, stop conditions and qualitative feedback.
- ROI must include build, people, review, maintenance and risk costs, not only model charges, and should survive sensitivity checks.
- Read results against the agreed targets, allowing for novelty effects, moved work and rare serious errors hidden by averages.
- Baseline
- A measurement of current performance taken before a change, using the same method as later.
- Return on investment (ROI)
- Net benefit divided by total cost.
- Conversion rate
- The share of interactions that end in a desired action, such as a booking.
- Customer lifetime value
- The total value of a customer relationship over time.
- Guardrail metric
- A measure that must not get worse while the main metrics improve.
- Pilot
- A limited, real-world trial with measurement and a fallback.
Practice problems
Work each problem on paper first, then reveal the answer to check.
Why measure a baseline before the pilot?
Show answer
Without it, there is nothing reliable to compare results against.
Which costs usually dominate the first year of a generative AI tool?
Show answer
Build effort and people costs such as review, not model token charges.
What is a guardrail metric for the overnight summaries?
Show answer
Clinically important details missed, which must not increase.
Lesson quiz · 5 questions
Score 60% or more to complete this lesson.
Create a free account to save your progress, take quizzes and earn a certificate.