
AI-420 · Lesson 6 of 12 · 24 min
Model serving, latency and throughput
An online model is part of a product, and products have speed requirements. A search page must return results in a few hundred milliseconds, a payment must be approved in well under a second, and an ad auction may allow a model only ten milliseconds. Meeting these requirements at reasonable cost is a systems problem: it depends on the model's execution time, but also on queueing, batching, network hops, feature lookups and how many replicas are running. This lesson covers latency budgets and percentiles, the queueing behaviour that makes servers slow down sharply as they get busy, batching, autoscaling, caching, and the choice of hardware. Optimizations specific to large language models, such as KV caching and speculative decoding, are covered in AI-410, Lesson 8.
Latency budgets and percentiles
End-to-end latency is the time from a user's action to the response. A model is only one part of it, so teams set a latency budget for each component. For a fraud check with a 300 ms limit, the budget might allow 20 ms for the network, 30 ms for feature lookups from the online store, 50 ms for the model, and leave the rest for the payment system itself.
Latency must be described by percentiles, not averages. The median (p50) is the typical request; the 99th percentile (p99) is the time within which 99 % of requests finish. Users experience the tail: a page that calls ten services is slow if any one of them is slow, so a 1-in-100 slow response from each service makes roughly 1 in 10 pages slow. Service level objectives (SLOs) are therefore stated as percentiles, for example "p99 latency below 50 ms over each five-minute window".
Where the time goes
A request to a model service passes through several stages: network transfer, request parsing, feature retrieval (often several lookups), preprocessing, waiting in a queue for a free worker, model execution, postprocessing and the response. Profiling usually shows that model execution is not the only, or even the main, cost. Feature lookups that run one after another, JSON parsing of large payloads, or Python preprocessing can dominate. The first optimizations are often the cheapest: fetch features in parallel or in one batched call, keep connections open, avoid repeated conversions, and move heavy preprocessing out of the request path.
Queueing: why busy servers are slow
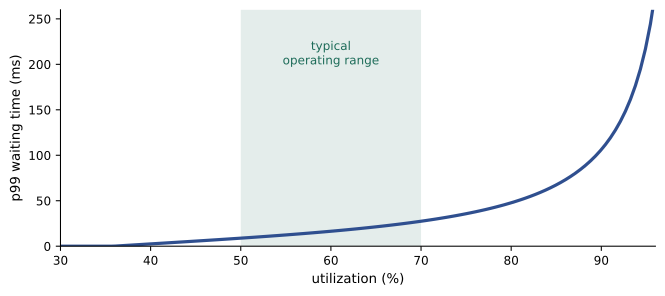
Requests arrive at random, not evenly spaced. When several arrive close together, some must wait for a free worker, and the waiting time grows sharply as the server approaches full utilization. Queueing theory describes this. The M/M/c model treats arrivals as random (Poisson) and service times as exponential, with c identical replicas; the Erlang C formula gives the probability that a request must wait, and from it the distribution of waiting times.
import math

# Queueing at a model server: c replicas, each serving one request at a time (M/M/c)
def erlang_c(c, a):
    # probability an arriving request must wait; a = offered load in replicas (lambda / mu)
    s = sum(a**k / math.factorial(k) for k in range(c))
    top = a**c / math.factorial(c) * c / (c - a)
    return top / (s + top)

service_ms = 20.0                  # mean model execution time per request
mu = 1000 / service_ms             # requests per second per replica
c = 8
print(f"{c} replicas, mean service {service_ms:.0f} ms, capacity {c * mu:.0f} requests/s")
for util in (0.5, 0.7, 0.8, 0.9, 0.95):
    lam = util * c * mu
    pw = erlang_c(c, lam / mu)
    rate = c * mu - lam                         # decay rate of waiting time, per second
    p99_wait = max(0.0, math.log(pw / 0.01) / rate * 1000) if pw > 0.01 else 0.0
    mean_wait = pw / rate * 1000
    print(f"  utilization {util:.0%}: P(wait) {pw:.2f}, mean wait {mean_wait:5.1f} ms, "
          f"p99 wait {p99_wait:6.1f} ms")

# Little law: requests in the system = arrival rate x time in system
lam = 0.8 * c * mu
print(f"At 80 % utilization, about {lam * (service_ms + 1000 * erlang_c(c, lam / mu) / (c * mu - lam)) / 1000:.1f} requests are in the system on average")8 replicas, mean service 20 ms, capacity 400 requests/s utilization 50%: P(wait) 0.06, mean wait 0.3 ms, p99 wait 8.9 ms utilization 70%: P(wait) 0.27, mean wait 2.3 ms, p99 wait 27.5 ms utilization 80%: P(wait) 0.46, mean wait 5.7 ms, p99 wait 47.8 ms utilization 90%: P(wait) 0.70, mean wait 17.5 ms, p99 wait 106.3 ms utilization 95%: P(wait) 0.84, mean wait 42.2 ms, p99 wait 221.8 ms At 80 % utilization, about 8.2 requests are in the system on average
At 50 % utilization, waiting is negligible: the p99 wait is under 10 ms. At 80 %, almost half of requests wait and the p99 wait is nearly 50 ms, more than twice the service time. At 95 %, the p99 wait exceeds 200 ms. Average latency rises only modestly, but the tail explodes, which is why model services are typically run well below full utilization, often at 50 to 70 %, with autoscaling adding capacity before the steep part of the curve. Real services differ from the idealized model (service times are less variable, traffic bursts are worse), but the shape of the curve is universal.
A related and very useful relationship is Little's law: the average number of requests in a system equals the arrival rate times the average time each spends in it.
At 320 requests per second and about 26 ms in the system, about 8 requests are in progress or waiting at any moment. Little's law helps size concurrency limits, connection pools and memory, and it holds for any stable system regardless of distributions.
Batching
Hardware such as GPUs is far more efficient processing many inputs together than one at a time, because a single input leaves most of the parallel compute idle. Batch inference exploits this. For offline jobs, large batches are simple. For online serving, dynamic batching collects requests that arrive within a short window (for example up to 5 ms, or until 32 requests are waiting) and runs them as one batch. Throughput rises dramatically, but each request may wait for the window to fill, adding latency. The batch size and window are tuned against the latency budget: at high traffic, batches fill quickly and add little delay; at low traffic, the maximum wait dominates. Model servers such as Triton and TorchServe implement dynamic batching, and language model servers use continuous batching, which adds new requests to a running batch at every generation step (AI-410, Lesson 8).
Worked problem
Sizing a batched GPU service
An image classifier on one GPU takes 8 ms for a batch of 1 and 24 ms for a batch of 16. Peak traffic is 500 requests per second, and the p99 latency target is 100 ms. How many GPUs are needed with and without batching?
Show solution
- Without batching: each GPU handles 1/0.008 = 125 requests per second at 100 % utilization. At a safe 60 % utilization, about 75 requests per second, so 500/75 ≈ 7 GPUs.
- With batches of 16: each GPU handles 16/0.024 ≈ 667 requests per second at full utilization, about 400 at 60 %, so 2 GPUs (one for capacity, one for headroom and redundancy).
- Check latency: a request may wait up to the batching window (say 10 ms) plus queueing and the 24 ms batch execution; with utilization at 60 % the p99 should stay well under 100 ms. This must be verified with a load test.
Answer: Batching cuts the number of GPUs from about 7 to 2, at the cost of a few tens of milliseconds of added latency that fits within the budget. Load testing confirms the tail behaviour, because queueing with batching is harder to predict analytically.
Autoscaling
Traffic varies by hour, day and season, and running enough replicas for the peak all the time wastes money. Autoscalers add and remove replicas based on a metric: CPU or GPU utilization, requests per second per replica, queue length or latency. The Kubernetes Horizontal Pod Autoscaler and serverless platforms (Knative, cloud functions, managed endpoints) are common tools. Three practical issues dominate. First, scaling takes time: starting a replica means scheduling a machine, pulling an image and loading a model, which can take minutes for large models on GPUs, so autoscalers must act before latency degrades, often with predictive schedules for known daily peaks. Second, scale-to-zero saves money for rarely used models but makes the first request after idle very slow (a cold start). Third, a minimum number of replicas spread across zones is needed for redundancy, whatever the traffic.
Caching and precomputation
If the same inputs recur, their predictions can be cached. Recommendation systems often precompute candidate lists in batch and use the online model only to rerank a few hundred candidates; search systems cache results for popular queries; embedding services cache embeddings for frequent items. Caches need expiry policies so that stale predictions are refreshed, and they change the traffic a model sees, which matters for monitoring. A hybrid of batch precomputation and lightweight online adjustment is one of the most effective serving designs.
Hardware and model efficiency
Many tabular models, such as gradient boosted trees and logistic regression, run in well under a millisecond on CPUs, and GPUs bring no benefit. Deep networks for images, audio and text usually need GPUs or other accelerators to meet latency and cost targets. Between the two, techniques that make models cheaper to run include quantization (storing weights in 8-bit or 4-bit integers instead of 32-bit floats), distillation (training a small model to imitate a large one), pruning, and compilation with runtimes such as ONNX Runtime or TensorRT that fuse operations for specific hardware. Each must be checked for accuracy loss with the tests of Lesson 4, because a faster model that is noticeably worse is not an improvement.
Load testing
Serving performance must be measured, not assumed. Load tests send realistic traffic, with the real mix of input sizes and request patterns, at increasing rates and record latency percentiles, throughput, errors and resource use. They find the rate at which the SLO is breached, show how the service behaves when overloaded (does it shed load gracefully or collapse?), and validate autoscaling. Tools such as Locust, k6 and vendor benchmarking tools make this routine; load tests should run before every major release and whenever the model or hardware changes.
Results should be compared with the latency budget at realistic traffic peaks, not just average days, since capacity must cover the busiest hour of the busiest season.
Common mistakes
MistakeReporting average latency.
InsteadSet and monitor SLOs on percentiles such as p99.
MistakeAssuming model execution is the main cost.
InsteadProfile the whole request path, including features and parsing.
MistakeRunning replicas near 100 % utilization.
InsteadKeep utilization moderate and scale before the tail rises.
MistakeScaling to zero for latency-critical models.
InsteadKeep warm minimum replicas across zones.
MistakeDeploying a quantized or distilled model without retesting.
InsteadVerify accuracy and behaviour before release.
Summary and key terms
- Latency budgets divide the end-to-end limit among components.
- SLOs use percentiles because users experience the tail.
- Queueing makes tail latency rise steeply as utilization approaches 100 %.
- Little's law, L = λW, relates concurrency, arrival rate and time in system.
- Dynamic batching trades a little latency for large throughput gains on accelerators.
- Autoscaling must account for start-up time, cold starts and redundancy.
- Caching, precomputation, efficient hardware and model compression cut cost; load tests verify.
- Latency budget
- The share of an end-to-end time limit allotted to a component.
- p99 latency
- The time within which 99 % of requests complete.
- SLO
- Service level objective: a target for a measured service metric.
- Utilization
- The fraction of capacity in use.
- Erlang C
- A formula for the probability of waiting in an M/M/c queue.
- Little's law
- Average items in a system equal arrival rate times time in system.
- Dynamic batching
- Grouping requests that arrive within a short window.
- Autoscaling
- Automatically adjusting the number of replicas.
- Cold start
- The delay serving the first request after a replica starts.
- Quantization
- Storing weights and computing with lower-precision numbers.
Practice problems
Work each problem on paper first, then reveal the answer to check.
Why are latency SLOs stated as percentiles?
Show answer
Users experience the tail, and averages hide slow requests.
A page calls ten services, each slow 1 % of the time independently. Roughly what fraction of pages is slow?
Show answer
1 − 0.99¹⁰ ≈ 9.6 %.
From the output, what is the p99 wait at 70 % and at 95 % utilization?
Show answer
About 27.5 ms and 222 ms.
Why do services run at moderate utilization?
Show answer
Tail latency rises steeply near full utilization.
Using Little's law, how many requests are in a system with 200 requests per second and 50 ms in system?
Show answer
200 × 0.05 = 10.
What does dynamic batching trade?
Show answer
A small added wait for much higher throughput.
In the GPU example, how many requests per second does one GPU handle at batch 16 at full utilization?
Show answer
About 667.
Why can autoscaling be too slow for sudden peaks?
Show answer
Starting replicas and loading models can take minutes.
Name two techniques that reduce model execution cost.
Show answer
Quantization, distillation, pruning, compilation.
What does a load test reveal?
Show answer
The rate at which SLOs break, overload behaviour and whether autoscaling works.
Lesson quiz · 5 questions
Score 60% or more to complete this lesson.
Create a free account to save your progress, take quizzes and earn a certificate.