
AI-420 · Lesson 5 of 12 · 24 min
Packaging and deployment patterns
Deploying a model means taking a trained artifact from the registry and putting it where it can make predictions for real users or processes, without breaking anything that works today. This lesson covers how models are packaged with their dependencies, the formats used to store them, the interfaces through which applications call them, and the deployment strategies (blue-green, canary, shadow and others) that let teams release new models gradually, measure their effect, and roll back quickly when something goes wrong.
Packaging a model
A trained model is more than a file of weights. To make predictions it needs the preprocessing code that turns raw inputs into features, the exact library versions it was trained with, and often a tokenizer, vocabulary or lookup tables. Packaging bundles these together so the model runs identically wherever it is deployed. The standard unit is a container image (usually Docker): a snapshot of the operating system libraries, the language runtime, pinned Python packages, the serving code and the model artifact. The image is built automatically from the registry entry (Lesson 3), tagged with the model version, scanned for vulnerabilities and stored in a container registry from which deployment systems pull it.
Some teams bake the model into the image; others keep a generic serving image and load the model at start-up from object storage. Baking in makes each image fully self-contained and reproducible; loading at start-up makes images smaller and lets one image serve many model versions. Either works if the combination of image and model version is recorded.
Model formats
Models are saved in different formats, with different trade-offs:
| Format | Typical use | Notes |
|---|---|---|
| Pickle / joblib | scikit-learn and general Python objects | Simple, but tied to library versions; loading an untrusted pickle can execute arbitrary code |
| Safetensors | Neural network weights | Stores tensors only, no code execution; fast loading |
| ONNX | Portable inference across frameworks and runtimes | Export from PyTorch, scikit-learn and others; run with ONNX Runtime on many devices |
| TorchScript / torch.export | PyTorch models without Python dependencies | Serializes the computation graph for C++ and mobile runtimes |
| SavedModel | TensorFlow models | Includes graph and weights; served by TensorFlow Serving |
| Framework-specific engines | Optimized GPU inference | For example TensorRT; compiled for a specific GPU type |
The security note on pickle matters: pickle files can contain instructions that run when loaded, so a model downloaded from an untrusted source is a potential attack vector (Lesson 11). Formats that store only numerical tensors, such as safetensors, avoid this. Portable formats such as ONNX also decouple training from serving, so a model trained in one framework can be served by an optimized runtime in another, but conversions should be verified with a golden test (Lesson 4), because operators are sometimes implemented slightly differently.
Serving interfaces
Online models are usually exposed as a network service. REST APIs over HTTP with JSON bodies are simple and universal; gRPC with Protocol Buffers is faster and strongly typed, favoured for high-throughput internal services. The request and response formats should be explicit, versioned contracts: the input fields, their types and units, and the output fields, including the model version that produced the prediction. Including the model version in every response makes logs traceable to the registry (Lesson 3). Specialized model servers, such as NVIDIA Triton, TorchServe, TensorFlow Serving, KServe, BentoML and vLLM for language models, provide batching, multiple model versions, health checks and metrics out of the box, and are covered further in Lesson 6.
Batch models need no API: a scheduled job loads the model, scores a table and writes results. They still benefit from the same packaging, so the batch job and any online service use identical code and dependencies.
Deployment strategies
Replacing a model in production is risky, because offline tests cannot anticipate everything. Deployment strategies limit the exposure of a new version and make rollback fast:
- Recreate: stop the old version and start the new one. Simple, but causes downtime and exposes all traffic at once. Acceptable only for non-critical batch jobs.
- Rolling update: replace instances a few at a time. No downtime, but for a while both versions serve traffic in an uncontrolled mix.
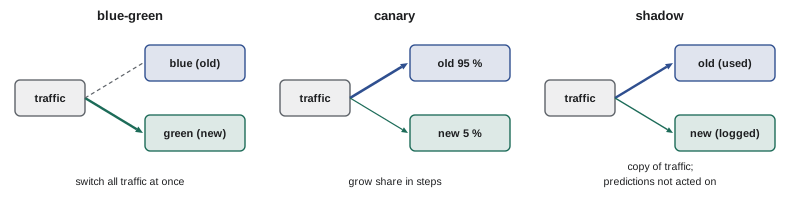
- Blue-green: run the new version (green) alongside the old (blue), then switch all traffic at once by changing a router or load balancer. Rollback is an immediate switch back, at the cost of running two full environments during the change.
- Canary: send a small share of traffic (say 1 to 5 %) to the new version, compare its metrics with the old version, and increase the share in steps if all is well. Problems affect only a few users.
- Shadow (or dark launch): send a copy of live traffic to the new version, record its predictions, but act only on the old version's predictions. Shadow testing exposes no users at all and is ideal for checking latency, errors and prediction distributions on real data, but it cannot measure user reactions.
- A/B test: split traffic randomly between versions for long enough to measure business outcomes with statistical confidence (Lesson 8).
A common sequence for an important model is shadow first (to catch errors and skew with no user impact), then canary at increasing shares (to catch harmful effects with limited exposure), then a full A/B test if the business impact needs measuring, and finally full rollout. Each step has explicit promotion criteria and automatic rollback triggers.
Canary analysis
A canary is only useful if someone, or something, compares it with the baseline and decides. Automated canary analysis compares metrics such as error rates, latency percentiles, prediction distributions and business proxies between the canary and the baseline, using statistical tests to decide whether a difference is real. The difficulty is that a small canary receives little traffic, so small but important differences take time to detect.
import numpy as np
from scipy.stats import norm

# Canary analysis: is the new model worse than the old one on a live metric?
def z_test(x_new, n_new, x_old, n_old):
    p_new, p_old = x_new / n_new, x_old / n_old
    p = (x_new + x_old) / (n_new + n_old)
    se = np.sqrt(p * (1 - p) * (1 / n_new + 1 / n_old))
    return p_new, p_old, (p_new - p_old) / se

# After one hour at 5 % of traffic: requests that ended in a complaint or manual override
p_new, p_old, z = z_test(x_new=96, n_new=6000, x_old=1620, n_old=114000)
print(f"Canary {p_new:.2%} vs baseline {p_old:.2%}: z = {z:.2f}, one-sided p = {1 - norm.cdf(z):.3f}")

# How long until a canary can detect a 20 % relative increase from a 1.4 % base rate?
base, lift, alpha, power = 0.014, 1.2, 0.05, 0.8
za, zb = norm.ppf(1 - alpha), norm.ppf(power)
p1, p2 = base, base * lift
n_needed = (za + zb) ** 2 * (p1 * (1 - p1) + p2 * (1 - p2)) / (p2 - p1) ** 2
print(f"Canary requests needed: {n_needed:,.0f}")
for share in (0.01, 0.05, 0.20):
    hours = n_needed / (120000 * share)
print(f" at {share:4.0%} of 120,000 requests per hour: {hours:5.1f} hours")Canary 1.60% vs baseline 1.42%: z = 1.14, one-sided p = 0.128 Canary requests needed: 23,911 at 1% of 120,000 requests per hour: 19.9 hours at 5% of 120,000 requests per hour: 4.0 hours at 20% of 120,000 requests per hour: 1.0 hours
After an hour at 5 % of traffic, the canary's bad-outcome rate is 1.60 % against 1.42 % for the baseline, but the difference is not statistically significant (p = 0.13): it might be noise or a real 13 % deterioration. To detect a 20 % relative increase reliably needs about 24,000 canary requests (the standard formula for two equal groups, slightly conservative here because the baseline is much larger), which takes about 20 hours at 1 % of traffic, 4 hours at 5 % and an hour at 20 %. Teams therefore balance exposure against detection speed: a tiny canary is safe for catastrophic failures, which show up immediately, but slow to reveal subtle regressions. Guardrails such as error rates and latency get tight thresholds and fast rollback; subtle quality changes are better measured by a properly sized A/B test.
Rollback and feature flags
Every deployment needs a tested rollback plan. With blue-green and canary deployments, rollback means routing traffic back to the old version, which should still be running. The previous model version stays in the registry, and its container image stays available, so redeploying it takes minutes. Feature flags (configuration switches read at run time) add another layer: an application can be told to stop calling the new model, or to fall back to a rule-based default, without any deployment at all. Fallbacks matter because a model service can fail entirely; the calling application should have a sensible behaviour, such as a default score or a simpler model, when the model does not answer in time.
Worked problem
Planning a release
A bank is replacing its card fraud model. The new model has better offline precision at the same recall. Fraud losses are measured from chargebacks that arrive up to 60 days later. Propose a release plan.
Show solution
- Shadow for one week: score every transaction with both models, act only on the old one. Check latency, error rates, score distributions and the agreement between models; investigate transactions where they disagree strongly.
- Canary at 5 % for one week with automatic rollback on latency or error-rate breaches, and monitoring of decline rates and customer complaints, which are available immediately.
- A/B test at 50 % for long enough to estimate fraud losses from chargebacks, which requires waiting for the label delay of up to 60 days, using decline rate and early fraud reports as leading indicators in the meantime.
- Full rollout once losses and customer metrics are confirmed, keeping the old model deployable for quick rollback.
Answer: The plan moves from zero exposure to full rollout in steps, each with criteria that can be measured in the time available. Label delay drives the length of the final stage, so leading indicators are used to catch problems early.
Deploying to the edge
Some models run on phones, vehicles, cameras or industrial controllers rather than in a data centre, for latency, privacy or connectivity reasons. Edge deployment adds constraints: limited memory and compute (often requiring quantization or smaller architectures), many hardware variants, devices that update slowly or never, and the need to monitor models that are not under direct control. Releases are staged by device groups, and models are often signed so devices accept only authentic updates.
Whatever the strategy, deployments should be automated and recorded. A deployment log that shows which model version, image and configuration went live, when, by whom and through which stages, is the first place investigators look when an incident begins.
Common mistakes
MistakeDeploying a model file without its preprocessing and pinned dependencies.
InsteadPackage model, code and environment together in a versioned image.
MistakeLoading pickled models from untrusted sources.
InsteadUse tensor-only formats such as safetensors, or verify provenance.
MistakeSwitching all traffic to a new model at once.
InsteadUse shadow and canary stages with promotion criteria.
MistakeJudging a canary by eye after an hour.
InsteadUse statistical comparison and size the canary for the effect to detect.
MistakeHaving no fallback when the model service fails.
InsteadProvide default scores or a simpler model behind a feature flag.
Summary and key terms
- Packaging bundles model, preprocessing and pinned dependencies, usually in a container image.
- Formats trade portability, speed and security; untrusted pickles can run code.
- Online models expose versioned REST or gRPC contracts that report the model version.
- Blue-green, canary and shadow deployments limit exposure and enable fast rollback.
- Small canaries catch catastrophic failures quickly but subtle regressions slowly.
- Rollback plans, feature flags and fallbacks make failures recoverable.
- Edge deployment adds hardware, update and monitoring constraints.
- Container image
- A packaged, versioned runtime environment for an application.
- ONNX
- An open format for portable model inference.
- Safetensors
- A format storing tensors only, without executable code.
- gRPC
- A fast, typed remote procedure call protocol.
- Blue-green deployment
- Switching traffic between two complete environments.
- Canary deployment
- Sending a small share of traffic to a new version.
- Shadow deployment
- Running a new version on copied traffic without acting on it.
- Rollback
- Returning to the previous version.
- Feature flag
- A run-time switch that changes behaviour without redeployment.
- Fallback
- Behaviour used when the model is unavailable.
Practice problems
Work each problem on paper first, then reveal the answer to check.
What does a model container image contain?
Show answer
System libraries, runtime, pinned packages, serving code and usually the model artifact.
Why are pickle files a security concern?
Show answer
Loading them can execute arbitrary code.
Why include the model version in every API response?
Show answer
So predictions in logs can be traced to the registry.
What is the main advantage of blue-green deployment?
Show answer
Instant switch and instant rollback.
What can shadow deployment not measure?
Show answer
User reactions and business outcomes, because its predictions are not acted on.
From the output, is the canary significantly worse after one hour?
Show answer
No; p = 0.13.
From the output, how long does a 5 % canary need to detect a 20 % relative increase?
Show answer
About 4 hours.
Why are tiny canaries still useful?
Show answer
Catastrophic failures show up immediately with little exposure.
In the fraud example, why does the A/B stage last so long?
Show answer
Chargeback labels arrive up to 60 days later.
Name two constraints of edge deployment.
Show answer
Limited compute and memory, many hardware variants, slow updates, harder monitoring.
Lesson quiz · 5 questions
Score 60% or more to complete this lesson.
Create a free account to save your progress, take quizzes and earn a certificate.