
AI-410 · Lesson 6 of 12 · 26 min
Evaluating language models
How good is a language model? The question sounds simple, but it is one of the hardest in the field. Language models produce open-ended text, perform thousands of different tasks, and are sensitive to small changes in how a question is asked. Their training data may contain the very test questions used to measure them. Their developers have strong incentives to report favourable numbers. And the abilities that matter most to users, such as giving sound advice, writing working software or carrying out a long task without supervision, are the hardest to score automatically. This lesson covers the main kinds of benchmarks and how they are scored, the statistics needed to tell real differences from noise, evaluation by human preference, the use of models as judges, and how to evaluate a specific application rather than a model in general.
What benchmarks measure
A benchmark is a fixed set of tasks with a scoring method, used to compare models on the same footing. Widely used benchmarks fall into several groups:
- Knowledge and general understanding: multiple-choice questions across academic subjects, such as MMLU (57 subjects, released in 2020) and its harder successor MMLU-Pro.
- Mathematics: grade-school word problems (GSM8K), competition problems (MATH), and recent olympiad-style contest problems such as those of the American Invitational Mathematics Examination (AIME).
- Science: graduate-level questions written by experts to be hard to answer even with web search, such as GPQA Diamond.
- Coding: writing functions that pass unit tests (HumanEval), and resolving real issues in open-source repositories (SWE-bench, and its human-validated subset SWE-bench Verified).
- Agentic tasks: completing multi-step tasks in a terminal, a browser or a simulated workplace using tools.
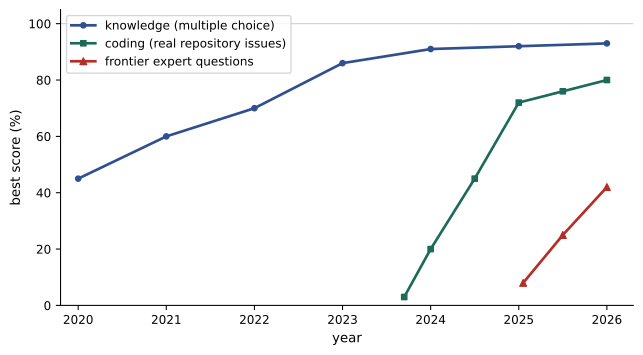
- Frontier difficulty: collections of very hard expert questions, such as Humanity's Last Exam, released in January 2025, on which the best models initially scored below 10 percent.
- Long context, multilingual ability, instruction following, factuality and safety.
Benchmarks have a life cycle. When released, a good benchmark separates current models; as models improve, scores approach the ceiling and the benchmark saturates, no longer distinguishing the best systems. MMLU, once a demanding test, saw top scores above 90 percent by 2024, and GSM8K saturated even earlier. Some apparent ceiling is also noise: a few percent of the questions in many benchmarks have wrong or ambiguous answers, so scores above a certain level mean little. The field therefore keeps producing harder benchmarks, and the most informative ones measure tasks of growing length and realism.
How answers are scored
The scoring method can change results as much as the model does:
- Multiple choice can be scored by asking the model to generate a letter, or by comparing the probability the model assigns to each option. The two can give different rankings, especially for smaller models.
- Exact match compares a generated answer (such as a number) with the reference, after normalization. Formatting differences (writing "1/2" rather than "0.5") can cause false failures unless answers are parsed carefully.
- Functional correctness runs generated code against unit tests, or checks a mathematical answer with a verifier. It is objective, but tests may be incomplete, so code that passes may still be wrong.
- Rubric grading compares free-text answers against criteria, by human experts or by a model acting as judge.
For tasks where a model may succeed on some attempts but not others, results are often reported as pass@k, the probability that at least one of \(k\) samples is correct. Generating exactly \(k\) samples and checking whether any pass gives a noisy estimate; instead, an unbiased estimator draws \(n \ge k\) samples, counts the \(c\) that pass, and computes:
averaged over problems.
import numpy as np
from math import comb

# 1. pass@k for code generation: n samples per problem, c of them pass the unit tests
def pass_at_k(n, c, k):
    if n - c < k:
        return 1.0
    return 1 - comb(n - c, k) / comb(n, k)

correct = [0, 1, 3, 10, 20, 0, 2, 15, 5, 8]          # passing samples out of n = 20 for 10 problems
n = 20
for k in (1, 5, 10):
    est = np.mean([pass_at_k(n, c, k) for c in correct])
    print(f"pass@{k:<2d} = {est:.3f}")

# 2. Is model B really better than model A? Paired results on the same 500 questions
rng = np.random.default_rng(42)
items = 500
difficulty = rng.uniform(0, 1, items)
a = (rng.uniform(0, 1, items) > difficulty * 0.95).astype(int)
b = np.where(rng.uniform(0, 1, items) < 0.85, a, (rng.uniform(0, 1, items) > difficulty * 0.85).astype(int))
pa, pb = a.mean(), b.mean()
se = np.sqrt(pa * (1 - pa) / items)
print(f"model A {pa:.3f} (standard error {se:.3f}), model B {pb:.3f}, difference {pb - pa:+.3f}")
diffs = []
for _ in range(5000):
    idx = rng.integers(0, items, items)               # resample questions, keeping pairs together
    diffs.append(b[idx].mean() - a[idx].mean())
lo, hi = np.percentile(diffs, [2.5, 97.5])
print(f"paired bootstrap 95% interval for the difference: {lo:+.3f} to {hi:+.3f}")
se_unpaired = np.sqrt(pa * (1 - pa) / items + pb * (1 - pb) / items)
print(f"if the questions were different (unpaired): about +/- {1.96 * se_unpaired:.3f}")pass@1 = 0.320 pass@5 = 0.604 pass@10 = 0.714 model A 0.518 (standard error 0.022), model B 0.532, difference +0.014 paired bootstrap 95% interval for the difference: -0.010 to +0.038 if the questions were different (unpaired): about +/- 0.062
Pass@k rises steeply with \(k\) for problems that the model solves only sometimes, which is why it is important to know which \(k\) a reported number uses. A pass@10 score is relevant when a developer can run tests and pick a working answer from several candidates, but users typically see one answer, so pass@1 is the more honest measure of everyday reliability.
Telling real differences from noise
A benchmark score is an estimate based on a finite sample of questions. If a model answers a fraction \(p\) of \(n\) questions correctly, the standard error of its accuracy is approximately:
With 500 questions and accuracy near 50 percent, the standard error is about 2.2 percentage points, so a 95 percent confidence interval spans roughly plus or minus 4.4 points. Many leaderboard differences between models are smaller than this. The second part of the output above shows that model B scores 1.4 points higher than model A, but the 95 percent interval for the difference runs from about minus 1 to plus 4 points, so the evidence that B is better is weak.
Two practices tighten comparisons. Paired analysis compares models on the same questions, so that variation in question difficulty cancels out: the paired interval in the output (about plus or minus 2.4 points) is much narrower than the unpaired one (plus or minus 6.2 points). Repeating the evaluation with several samples per question, or several prompt formats, measures and reduces variation from sampling randomness and phrasing. Studies have shown that changing the wording, the order of options or the number of examples in a prompt can move scores by several points, so a robust evaluation reports results across formats, or at least fixes and discloses the format used.
Worked problem
How many questions are enough?
A team wants to detect a 3-percentage-point difference in accuracy between two models near 70 percent, with a 95 percent confidence interval of plus or minus 1.5 points on each model's accuracy (ignoring the benefit of pairing). How many questions do they need?
Show solution
- Required standard error: \(1.5 / 1.96 = 0.77\) points \(= 0.0077\).
- Solve \(\sqrt{0.7 \times 0.3 / n} = 0.0077\): \(n = 0.21 / 0.0077^2 \approx 3{,}540\).
Answer: About 3,500 questions. Paired comparisons need fewer, because correlated errors cancel, but the calculation shows why benchmarks with a few hundred items cannot reliably separate models that differ by a couple of points.
Human preference evaluation
For open-ended tasks such as conversation, writing and advice, there is no single correct answer. The most direct measure is to ask people which of two responses they prefer. Crowdsourced platforms such as LMArena (originally Chatbot Arena, launched in 2023) show users two anonymous model responses to their own prompt and record which they prefer. Millions of such votes are combined into a ranking with the Bradley-Terry model, the same model used for reward models in Lesson 5: each model has a strength \(p_i\), and model \(i\) is preferred over model \(j\) with probability \(p_i / (p_i + p_j)\). Ratings are usually expressed on an Elo-like scale, where a 400-point gap corresponds to odds of 10 to 1.
import numpy as np

# Bradley-Terry ratings from pairwise human preferences (as in crowdsourced arenas)
models = ["Model P", "Model Q", "Model R", "Model S"]
# wins[i][j] = number of times model i was preferred over model j
wins = np.array([[0, 60, 70, 80],
                 [40, 0, 55, 70],
                 [30, 45, 0, 60],
                 [20, 30, 40, 0]], dtype=float)
p = np.ones(len(models))
for _ in range(200):                      # minorization-maximization updates
    for i in range(len(models)):
        num = wins[i].sum()
        den = sum((wins[i, j] + wins[j, i]) / (p[i] + p[j]) for j in range(len(models)) if j != i)
        p[i] = num / den
    p /= np.exp(np.mean(np.log(p)))
elo = 1000 + 400 * np.log10(p)            # express on an Elo-like scale
for name, r in sorted(zip(models, elo), key=lambda x: -x[1]):
    print(f"{name}: rating {r:6.0f}")
# Predicted probability that P beats S, from the ratings
diff = elo[0] - elo[3]
print(f"P vs S: rating gap {diff:.0f}, predicted win rate {1 / (1 + 10 ** (-diff / 400)):.2f}, observed {wins[0, 3] / 100:.2f}")Model P: rating 1113 Model Q: rating 1028 Model R: rating 972 Model S: rating 887 P vs S: rating gap 227, predicted win rate 0.79, observed 0.80
Preference rankings capture qualities that benchmarks miss, but they have their own biases. Voters tend to prefer longer, more confident and more elaborately formatted answers, so platforms now offer rankings that control for style. Voters may not be able to check factual accuracy or code correctness. The prompts reflect the interests of the platform's users rather than any particular application. And developers can tune models for the arena: in April 2025, Meta was criticized for ranking an experimental, chat-optimized version of a Llama 4 model on LMArena that differed from the version it released publicly, after which the platform tightened its policies. Preference rankings are most useful as one signal among several.
Models as judges
Human evaluation is slow and expensive, so models are widely used to grade other models' outputs, either by scoring a single response against a rubric or by choosing the better of two. Strong models agree with expert human judgements on many tasks about as often as humans agree with each other. Model judges have known biases, however:
- Position bias: preferring whichever response appears first (or second).
- Verbosity bias: preferring longer responses.
- Self-preference: favouring responses from the same model family.
- Limited expertise: failing to notice subtle errors in specialized content, especially if the judge cannot solve the problem itself.
Good practice is to evaluate each pair in both orders, give the judge a specific rubric and reference answers where possible, ask for reasoning before the verdict, and above all measure agreement between the judge and human experts on a sample before trusting it at scale.
Evaluating an application
General benchmarks indicate which models are worth trying, but they do not tell an organization whether a model will work for its own task. Teams building with language models need their own evaluation sets: a few hundred realistic inputs drawn from the actual use case, each with an expected output or a grading rubric, including difficult and adversarial cases and examples of past failures. Building this set is often the most valuable part of an AI project, because it turns vague requirements ("answers should be helpful and accurate") into measurable criteria.
Evaluation then becomes part of development, much as tests are in software engineering. Every change to the prompt, the retrieval configuration, the model or the tools is run against the set, and changes that improve one category while breaking another are caught before release. Error analysis, reading and categorizing failures, shows where to focus effort. After release, production monitoring samples real interactions, collects user feedback, tracks metrics such as task success, escalation rate and cost, and adds new failure cases to the test set. Lesson 12 develops this approach in a complete project.
| Evaluation type | Answers the question | Main limitation |
|---|---|---|
| Public benchmarks | How does this model compare on standard tasks? | Saturation, contamination, may not match your task |
| Human preference rankings | Which model do people prefer in open conversation? | Style bias; prompts may not match your use |
| Model-as-judge | How good are many outputs, quickly? | Judge biases; must be validated against humans |
| Application test set | Does this system work for our task? | Effort to build and maintain |
| Production monitoring | Is it working for real users now? | Feedback is sparse and delayed |
Capability and safety evaluations
Developers and governments also evaluate models for dangerous capabilities, such as helping with cyberattacks, biological or chemical weapons, or autonomous replication, and for safety properties such as resistance to jailbreaks and honesty about uncertainty. These evaluations combine automated tests with expert red-teaming, and their results feed into decisions about whether and how to release a model. Frontier developers publish frameworks describing the capability thresholds that trigger additional safeguards, and government bodies such as the Canadian AI Safety Institute, the US Center for AI Standards and Innovation and the UK AI Security Institute test models before or after release. AI-430 covers this area in depth, and Lesson 11 looks at the safeguards applied when models are deployed.
Common mistakes
MistakeDeclaring one model better on a difference smaller than the confidence interval.
InsteadCompute standard errors and use paired comparisons.
MistakeReporting pass@10 as if it were everyday reliability.
InsteadState k clearly; pass@1 reflects a single attempt.
MistakeTrusting a model judge without validation.
InsteadMeasure agreement with human experts and control for position and length.
MistakeChoosing a model by its leaderboard rank alone.
InsteadTest candidates on an evaluation set built from your own use case.
MistakeTreating benchmarks as permanent measures of progress.
InsteadExpect saturation and contamination; use fresh, harder tasks.
Summary and key terms
- Benchmarks cover knowledge, mathematics, science, coding, agentic tasks and frontier-difficulty questions.
- Benchmarks saturate as models improve, and label errors limit meaningful top scores.
- Scoring choices (likelihood vs generation, exact match, unit tests, rubrics) affect results.
- Unbiased pass@k uses n samples with c correct; pass@1 reflects single-attempt reliability.
- Accuracy has standard error √(p(1−p)/n); paired comparisons and repeated runs tighten intervals.
- Human preference rankings use Bradley-Terry ratings but favour style; model judges need validation.
- Application-specific test sets and monitoring are essential for real deployments.
- Benchmark
- A fixed set of tasks and a scoring method for comparing models.
- Saturation
- When scores approach the ceiling and a benchmark stops discriminating.
- Exact match
- Scoring by comparing a normalized answer with the reference.
- pass@k
- The probability that at least one of k samples is correct.
- Standard error
- The standard deviation of an estimate due to finite sampling.
- Paired comparison
- Comparing two models on the same items so item difficulty cancels.
- Bootstrap
- Estimating uncertainty by resampling the data with replacement.
- Bradley-Terry model
- A model of pairwise preferences based on item strengths.
- Model-as-judge
- Using a language model to grade or compare outputs.
- Evaluation set
- Realistic test inputs with expected outputs or rubrics for an application.
Practice problems
Work each problem on paper first, then reveal the answer to check.
Why do benchmarks saturate?
Show answer
Models improve until scores approach the ceiling, and remaining errors are often label noise.
Name two ways to score multiple-choice questions.
Show answer
Generate a letter, or compare option probabilities.
n = 10 samples, c = 2 correct. pass@1 and pass@5?
Show answer
pass@1 = 0.2; pass@5 = 1 − C(8,5)/C(10,5) = 1 − 56/252 = 0.778.
Accuracy 80% on 400 questions. Standard error?
Show answer
√(0.8 × 0.2 / 400) = 0.02, or 2 points.
Why are paired comparisons more precise?
Show answer
Shared question difficulty cancels out.
What does a 400-point rating gap mean on an Elo-like scale?
Show answer
Odds of 10 to 1, about a 91% win probability.
Name two biases of crowdsourced preference rankings.
Show answer
Preference for length, confidence or formatting; inability to check accuracy; unrepresentative prompts.
How can position bias in a model judge be reduced?
Show answer
Evaluate each pair in both orders.
What should an application evaluation set contain?
Show answer
Realistic inputs with expected outputs or rubrics, including hard, adversarial and past-failure cases.
Questions needed for ±2 points (95%) at 60% accuracy?
Show answer
SE = 0.0102; n = 0.24 / 0.0102² ≈ 2,300.
Lesson quiz · 5 questions
Score 60% or more to complete this lesson.
Create a free account to save your progress, take quizzes and earn a certificate.