
STAT-251 · Lesson 8 of 12 · 25 min
Common continuous distributions
Lesson 5 introduced the uniform and exponential densities. This lesson completes the family of continuous distributions used throughout probability and statistics: the gamma, which generalizes the exponential to waiting for several events; the normal, which describes sums of many small effects and is the subject of the central limit theorem in lesson 11; the beta, which lives on \([0, 1]\) and models proportions; and the Weibull and lognormal, workhorses of reliability and of insurance losses. For each we give the density, the story behind it, its mean and variance, and the facts that connect it with the others. STAT-252 adds the chi-square, \(t\) and \(F\) distributions, which are built from these.
The gamma function and the gamma distribution
The gamma function, \(\Gamma(\alpha) = \int_0^\infty x^{\alpha - 1}e^{-x}\,dx\) for \(\alpha > 0\), extends the factorial to real arguments. Integration by parts gives \(\Gamma(\alpha + 1) = \alpha\Gamma(\alpha)\), and \(\Gamma(1) = 1\), so \(\Gamma(n) = (n - 1)!\) for positive integers. A useful special value is \(\Gamma(1/2) = \sqrt{\pi}\), which follows from the normal integral below.
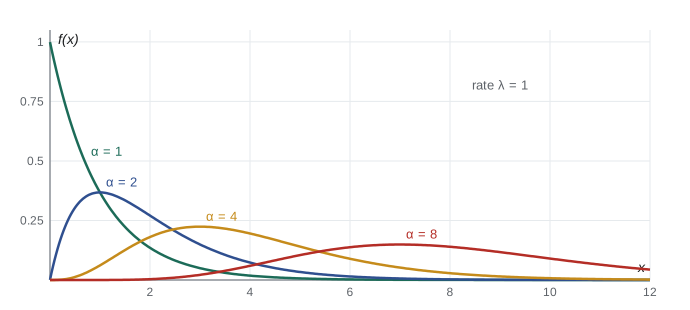
\(X\) has the gamma distribution with shape \(\alpha > 0\) and rate \(\lambda > 0\) if
It integrates to 1 by the substitution \(u = \lambda x\) and the definition of \(\Gamma\). The same substitution gives \(E[X^k] = \Gamma(\alpha + k)/(\Gamma(\alpha)\lambda^k)\), so \(E[X] = \alpha/\lambda\) and \(\operatorname{Var}(X) = \alpha/\lambda^2\). With \(\alpha = 1\) the gamma is the exponential. When \(\alpha = n\) is an integer, the gamma is the distribution of the sum of \(n\) independent exponential waiting times with rate \(\lambda\), sometimes called the Erlang distribution, which lesson 10 proves with moment generating functions. It is the waiting time until the \(n\)th event of a process with constant rate, such as the time until the third claim on a policy or the third failure in a system with two spares. Gamma distributions are also popular for claim amounts and rainfall totals, because their shape parameter gives flexible right skewness.
There is a neat link with the Poisson. If events occur at rate \(\lambda\) with independent exponential gaps, the \(n\)th event happens after time \(t\) exactly when fewer than \(n\) events have happened by \(t\). The number by time \(t\) is Poisson with mean \(\lambda t\), so \(P(\text{Gamma}(n, \lambda) > t) = \sum_{k=0}^{n-1}e^{-\lambda t}(\lambda t)^k/k!\). The two families describe the same process, one counting events in a fixed time and the other timing a fixed number of events.
The normal distribution
\(Z\) has the standard normal distribution if its density is
To see that it integrates to 1, let \(I = \int e^{-z^2/2}\,dz\). Then \(I^2 = \iint e^{-(x^2 + y^2)/2}\,dx\,dy\), and in polar coordinates this is \(\int_0^{2\pi}\int_0^\infty e^{-r^2/2}r\,dr\,d\theta = 2\pi\), so \(I = \sqrt{2\pi}\). This trick, squaring an integral to make it two-dimensional, is due to Poisson and is one of the prettiest in calculus. By symmetry \(E[Z] = 0\), and integrating by parts gives \(E[Z^2] = 1\), so \(\operatorname{Var}(Z) = 1\).
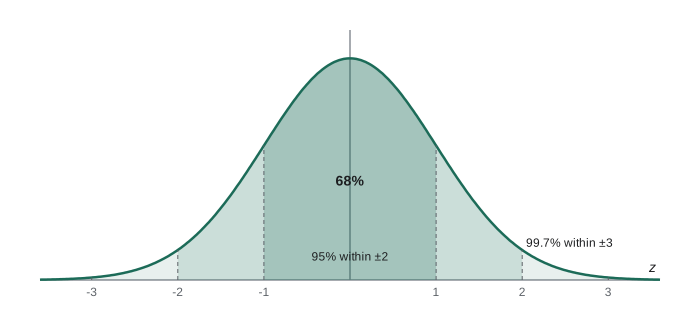
The general normal \(X \sim N(\mu, \sigma^2)\) is \(X = \mu + \sigma Z\), with density \(f(x) = \frac{1}{\sigma\sqrt{2\pi}}e^{-(x - \mu)^2/(2\sigma^2)}\), mean \(\mu\) and variance \(\sigma^2\). Every normal probability reduces to the standard normal cdf \(\Phi\): \(P(X \le x) = \Phi((x - \mu)/\sigma)\). The function \(\Phi\) has no elementary formula and is computed numerically; Python provides it through the error function, \(\Phi(z) = \frac12(1 + \operatorname{erf}(z/\sqrt2))\). Three numbers are worth memorizing: about 68%, 95% and 99.7% of a normal distribution lies within 1, 2 and 3 standard deviations of the mean. Compare these with Chebyshev's guarantees of 0%, 75% and 89%.
Normal distributions are closed under linear combinations of independent variables: if \(X \sim N(\mu_1, \sigma_1^2)\) and \(Y \sim N(\mu_2, \sigma_2^2)\) are independent, then \(aX + bY \sim N(a\mu_1 + b\mu_2, a^2\sigma_1^2 + b^2\sigma_2^2)\). Lesson 10 proves this with generating functions. This closure, together with the central limit theorem, is why the normal distribution is everywhere in statistics. It was de Moivre who first found the normal curve, in 1733, as an approximation to the binomial; Gauss later derived it as the law of measurement errors, which is why it is often called Gaussian.
Worked problem
Filling cereal boxes
A machine fills boxes with a net weight that is normal with mean 505 grams and standard deviation 4 grams. Boxes are labeled 500 grams. What fraction are underweight, and what mean setting would make only 1% underweight?
Show solution
- \(P(X < 500) = \Phi((500 - 505)/4) = \Phi(-1.25) \approx 0.106\).
- For 1% underweight we need \((500 - \mu)/4 = z_{0.01} \approx -2.326\).
- So \(\mu = 500 + 2.326 \times 4 \approx 509.3\) grams.
- Reducing the standard deviation to 2 grams instead would allow \(\mu \approx 504.7\), saving product on every box, which is why quality engineers chase variance.
Answer: About 10.6% are underweight; a mean of about 509.3 grams brings this to 1%.
The beta distribution
\(X\) has the beta distribution with parameters \(a, b > 0\) if
Its mean is \(a/(a + b)\) and its variance \(ab/((a + b)^2(a + b + 1))\). With \(a = b = 1\) it is the uniform on \((0, 1)\). Beta densities model proportions: the fraction of a day a machine is busy, the share of votes a candidate receives, the unknown success probability of a treatment. They are also the distributions of order statistics of uniform samples: the \(k\)th smallest of \(n\) independent uniforms on \((0, 1)\) is \(\text{Beta}(k, n - k + 1)\). In Bayesian statistics the beta is the natural prior for a binomial probability, because a beta prior updated with binomial data gives a beta posterior, a fact STAT-252 uses.
Weibull and lognormal
The Weibull distribution with shape \(k > 0\) and scale \(\theta > 0\) has survival function \(S(t) = \exp(-(t/\theta)^k)\) for \(t \ge 0\) and hazard \(h(t) = (k/\theta)(t/\theta)^{k-1}\). Its hazard increases for \(k > 1\), decreases for \(k < 1\) and is constant for \(k = 1\), the exponential. That flexibility makes it the standard model in reliability engineering for the lifetimes of bearings, insulation, wind turbine components and many other parts, and it also appears as the distribution of the weakest link in a chain of many components, a result from extreme value theory.
\(X\) is lognormal if \(\ln X\) is normal: \(X = e^{\mu + \sigma Z}\). Its mean is \(e^{\mu + \sigma^2/2}\), larger than its median \(e^\mu\), and it has a long right tail. Lognormal distributions arise when a quantity is the product of many small independent factors, by applying the central limit theorem to the logarithm. Incomes, particle sizes, the sizes of cities, stock prices over a fixed horizon and many insurance claim sizes are roughly lognormal. Because \(E[X]\) depends on \(\sigma^2\), averages of lognormal data are sensitive to the spread, and the mean claim on a book of business is driven by its largest claims.
Computing with continuous distributions
The code below uses only the standard library. It computes normal probabilities through the error function, checks the 68–95–99.7 rule, finds the cereal-box setting by bisection on \(\Phi\), verifies the gamma–Poisson identity, and simulates the gamma as a sum of exponentials and a beta as an order statistic of uniforms.
import math, random
from statistics import mean, pvariance

Phi = lambda z: 0.5 * (1 + math.erf(z / math.sqrt(2)))
for k in (1, 2, 3):
    print(f"P(|Z| < {k}) = {Phi(k) - Phi(-k):.4f}")

def z_quantile(q, lo=-10.0, hi=10.0):
    for _ in range(80):
        mid = (lo + hi) / 2
        lo, hi = (mid, hi) if Phi(mid) < q else (lo, mid)
    return (lo + hi) / 2
z01 = z_quantile(0.01)
print(f"underweight at mean 505: {Phi((500 - 505) / 4):.4f};  z_0.01 = {z01:.4f};  mean for 1%: {500 - 4 * z01:.2f}")

# gamma(3, rate 2): P(X > 1.5) from the Poisson formula, and by simulation as a sum of exponentials
lam, n, t = 2.0, 3, 1.5
exact = sum(math.exp(-lam * t) * (lam * t) ** k / math.factorial(k) for k in range(n))
rng = random.Random(251)
g = [sum(rng.expovariate(lam) for _ in range(n)) for _ in range(100_000)]
print(f"Gamma(3, 2): P(X > 1.5) exact {exact:.4f}, simulated {sum(x > t for x in g) / len(g):.4f}")
print(f"  mean {mean(g):.4f} (1.5), variance {pvariance(g):.4f} (0.75)")

# second smallest of 5 uniforms is Beta(2, 4): mean 1/3, variance 2/63
b = [sorted(rng.random() for _ in range(5))[1] for _ in range(100_000)]
print(f"Beta(2,4) via order statistic: mean {mean(b):.4f} (0.3333), var {pvariance(b):.5f} ({2/63:.5f})")

# lognormal: mean exceeds median
ln = [math.exp(rng.gauss(0, 1)) for _ in range(200_000)]
print(f"lognormal(0,1): mean {mean(ln):.3f} (e^0.5 = {math.exp(0.5):.3f}), median {sorted(ln)[100_000]:.3f} (1)")P(|Z| < 1) = 0.6827 P(|Z| < 2) = 0.9545 P(|Z| < 3) = 0.9973 underweight at mean 505: 0.1056; z_0.01 = -2.3263; mean for 1%: 509.31 Gamma(3, 2): P(X > 1.5) exact 0.4232, simulated 0.4241 mean 1.5042 (1.5), variance 0.7571 (0.75) Beta(2,4) via order statistic: mean 0.3330 (0.3333), var 0.03167 (0.03175) lognormal(0,1): mean 1.656 (e^0.5 = 1.649), median 1.006 (1)
Relationships among the families
The distributions of this lesson and the last form a connected web. The exponential is a gamma with shape 1 and a Weibull with shape 1. A sum of independent exponentials is gamma. The Poisson counts events whose gaps are exponential. The uniform is a beta with \(a = b = 1\), and uniform order statistics are beta. The binomial and Poisson are approximately normal when their means are large, by the central limit theorem. The lognormal is the exponential of a normal, and the chi-square of STAT-252 is a gamma with rate 1/2. Knowing these links means you do not have to memorize each distribution separately; you can derive facts about one from facts about another.
The value of Gamma(1/2) and the normal constant
The gamma function at one half connects the gamma family to the normal distribution. Substituting \(x = u^2/2\), so \(dx = u\,du\), in the definition gives
The last integral is half of \(\int_{-\infty}^\infty e^{-u^2/2}\,du = \sqrt{2\pi}\), a fact proved in lesson 10 with polar coordinates. So \(\Gamma(1/2) = \sqrt{2} \cdot \sqrt{2\pi}/2 = \sqrt{\pi}\). With the recursion \(\Gamma(\alpha + 1) = \alpha\Gamma(\alpha)\) this gives \(\Gamma(3/2) = \sqrt{\pi}/2\) and \(\Gamma(5/2) = 3\sqrt{\pi}/4\). The same calculation shows that the square of a standard normal has the gamma distribution with shape \(1/2\) and rate \(1/2\), the chi-squared distribution with one degree of freedom.
Worked example: standardizing in practice
Worked problem
Grading on a curve
Scores on a provincial mathematics exam are approximately normal with mean 68 and standard deviation 12. What score is needed to be in the top 10%, and what fraction of students score between 60 and 80?
Show solution
- The top 10% starts at the 90th percentile. From the table, \(\Phi(1.2816) = 0.90\), so the cut-off is \(68 + 1.2816 \times 12 \approx 83.4\).
- Standardize the interval: \(z_1 = (60 - 68)/12 = -0.667\) and \(z_2 = (80 - 68)/12 = 1\).
- \(P(60 < X < 80) = \Phi(1) - \Phi(-0.667) = 0.8413 - 0.2525 = 0.5888\).
Answer: A score of about 83.4 is needed for the top 10%, and about 59% of students score between 60 and 80.
Two facts make standardization reliable. First, if \(X \sim N(\mu, \sigma^2)\) then \((X - \mu)/\sigma\) is exactly standard normal, which follows from the linear change-of-variable rule; so one table, or one function such as Python's NormalDist().cdf, serves every normal distribution. Second, symmetry gives \(\Phi(-z) = 1 - \Phi(z)\), so tables need only list positive values. Real exam scores are bounded and slightly skewed, so the normal model is an approximation; it is usually good near the middle of the distribution and less reliable in the extreme tails, where decisions such as scholarships are often made.
Many Canadian growth charts, measurement standards and manufacturing tolerances use the same idea. A machine that fills 500 mL bottles with standard deviation 4 mL puts about 0.6% of bottles below 490 mL, since \(\Phi(-2.5) \approx 0.0062\). Raising the target mean to 502 mL cuts this to \(\Phi(-3) \approx 0.0013\), at the cost of 2 mL more product per bottle. Choosing the target is a trade-off between the cost of overfilling and the cost of underweight product, and the normal model makes that trade-off quantitative.
Why uniform order statistics are beta
The fact that uniform order statistics are beta has a short heuristic derivation. Draw \(n\) independent uniforms on \((0, 1)\) and let \(U_{(k)}\) be the \(k\)th smallest. For \(U_{(k)}\) to lie in a small interval \([x, x + dx]\), one of the \(n\) values must fall in that interval, \(k - 1\) of the others below \(x\) and \(n - k\) above. Counting the ways to assign the roles gives the density \(\frac{n!}{(k - 1)!\,(n - k)!}x^{k - 1}(1 - x)^{n - k}\), which is the beta density with \(a = k\) and \(b = n - k + 1\), since \(\Gamma(m) = (m - 1)!\). Its mean is \(a/(a + b) = k/(n + 1)\): the \(n\) sorted uniforms split the interval into \(n + 1\) gaps of equal expected length \(1/(n + 1)\). This is the reason plotting positions such as \(k/(n + 1)\) are used when comparing sorted data with a theoretical distribution, and it is how flood frequency analysts assign return periods to the largest floods on record: the largest of 50 annual floods is assigned an exceedance probability of about \(1/51\) per year.
Common mistakes
MistakeConfusing the rate and scale parameterizations of the gamma and exponential.
InsteadWith rate \(\lambda\) the mean is \(\alpha/\lambda\); with scale \(\theta = 1/\lambda\) it is \(\alpha\theta\). Check which one your software uses.
MistakeWriting \(N(\mu, \sigma)\) when the second parameter is the variance.
InsteadIn this course \(N(\mu, \sigma^2)\) has variance \(\sigma^2\); always say which you mean.
MistakeStandardizing with the variance instead of the standard deviation.
Instead\(Z = (X - \mu)/\sigma\).
MistakeTreating the lognormal mean as \(e^\mu\).
InsteadThat is the median; the mean is \(e^{\mu + \sigma^2/2}\).
MistakeUsing a normal model for quantities that cannot be negative and are highly skewed.
InsteadGamma, Weibull or lognormal models usually fit lifetimes and claim sizes better.
Summary and key terms
- \(\Gamma(\alpha + 1) = \alpha\Gamma(\alpha)\) and \(\Gamma(n) = (n - 1)!\); the gamma distribution has mean \(\alpha/\lambda\) and variance \(\alpha/\lambda^2\) and is a sum of exponentials when \(\alpha\) is an integer.
- The normal density integrates to 1 by the polar-coordinates trick; \(N(\mu, \sigma^2)\) probabilities reduce to \(\Phi\).
- Independent normals combine linearly into normals; 68%, 95% and 99.7% lie within 1, 2 and 3 standard deviations.
- The beta lives on \((0, 1)\) and describes proportions and uniform order statistics.
- Weibull hazards rise, fall or stay flat with the shape \(k\); the lognormal is \(e^{\text{normal}}\), with mean above median.
- gamma function
- \(\Gamma(\alpha) = \int_0^\infty x^{\alpha-1}e^{-x}\,dx\).
- gamma distribution
- Density \(\lambda^\alpha x^{\alpha-1}e^{-\lambda x}/\Gamma(\alpha)\) on \(x > 0\).
- standard normal
- Density \(e^{-z^2/2}/\sqrt{2\pi}\), cdf \(\Phi\).
- standardization
- \(Z = (X - \mu)/\sigma\).
- beta distribution
- Density proportional to \(x^{a-1}(1-x)^{b-1}\) on \((0, 1)\).
- Weibull distribution
- Survival \(\exp(-(t/\theta)^k)\).
- lognormal distribution
- The distribution of \(e^Y\) for normal \(Y\).
- order statistic
- The \(k\)th smallest value in a sample.
Practice problems
Work each problem on paper first, then reveal the answer to check.
Show that \(\Gamma(3/2) = \sqrt{\pi}/2\).
Show answer
\(\Gamma(3/2) = \frac12\Gamma(1/2) = \sqrt\pi/2\).
Heights of adults are \(N(170, 8^2)\) in centimeters. Find the proportion taller than 186 cm and the 90th percentile.
Show answer
\(1 - \Phi(2) \approx 0.023\); \(170 + 1.2816 \times 8 \approx 180.3\) cm.
Derive the mean of the gamma distribution directly.
Show answer
\(E[X] = \frac{\lambda^\alpha}{\Gamma(\alpha)}\int x^\alpha e^{-\lambda x}\,dx = \frac{\lambda^\alpha}{\Gamma(\alpha)}\cdot\frac{\Gamma(\alpha+1)}{\lambda^{\alpha+1}} = \frac{\alpha}{\lambda}\).
A Weibull lifetime has \(k = 2\), \(\theta = 10\) years. Find the probability of surviving 5 years and the hazard at 5 years.
Show answer
\(S(5) = e^{-0.25} \approx 0.779\); \(h(5) = (2/10)(5/10) = 0.1\) per year.
If \(X \sim N(10, 4)\) and \(Y \sim N(6, 9)\) are independent, find \(P(X > Y)\).
Show answer
\(X - Y \sim N(4, 13)\), so \(P(X - Y > 0) = \Phi(4/\sqrt{13}) \approx \Phi(1.109) \approx 0.866\).
Find the mean and variance of \(\text{Beta}(2, 2)\).
Show answer
Mean \(1/2\), variance \(4/(16 \times 5) = 1/20\).
Lesson quiz · 5 questions
Score 60% or more to complete this lesson.
Create a free account to save your progress, take quizzes and earn a certificate.