
STAT-151 · Lesson 5 of 12 · 26 min
Sampling distributions and the central limit theorem
If two research groups each measure the mean height of 30 randomly chosen seedlings from the same greenhouse, they will not get exactly the same answer. Each sample mean is a random variable: its value depends on which seedlings happen to be chosen. The sampling distribution of a statistic is the distribution of values it would take over all possible samples of the same size from the same population. Understanding sampling distributions is the key step from describing data to drawing conclusions from them, because every confidence interval and hypothesis test in this course is built on one. This lesson uses simulation to show how sampling distributions behave and introduces the central limit theorem, one of the most important results in all of mathematics for science.
Simulating a sampling distribution
In real research we have one sample and cannot see the sampling distribution directly. In a computer we can create a population, draw thousands of samples from it, and look at how a statistic varies. The simulation below uses an invented population of 100,000 fish lengths, then draws many samples of size 25 and records the mean of each.
import numpy as np
rng = np.random.default_rng(151)

# An invented population: lengths (cm) of 100,000 lake trout
population = rng.normal(48, 9, 100_000)
mu, sigma = population.mean(), population.std()

means = np.array([rng.choice(population, 25, replace=False).mean() for _ in range(5000)])
print(f"population mean {mu:.2f} cm, population SD {sigma:.2f} cm")
print(f"mean of 5,000 sample means      = {means.mean():.2f} cm")
print(f"SD of sample means (simulated)  = {means.std(ddof=1):.3f} cm")
print(f"sigma / sqrt(25) (theory)        = {sigma/np.sqrt(25):.3f} cm")
print(f"middle 95% of sample means: {np.percentile(means, 2.5):.2f} to {np.percentile(means, 97.5):.2f} cm")population mean 48.04 cm, population SD 9.01 cm mean of 5,000 sample means = 47.99 cm SD of sample means (simulated) = 1.789 cm sigma / sqrt(25) (theory) = 1.802 cm middle 95% of sample means: 44.41 to 51.47 cm
Three facts emerge, and they hold generally. First, the sample means are centered on the population mean: the sample mean is an unbiased estimator of μ. Second, the sample means vary much less than individual fish: their standard deviation is σ/√n, the standard error introduced in lesson 1. Third, 95 percent of sample means fall within about two standard errors of μ, as the normal distribution predicts.
The mean and standard error of the sample mean
These facts follow directly from the rules for expected values and variances in lesson 4. If X₁, …, Xₙ are independent observations from a population with mean μ and standard deviation σ, then the sample mean has expected value μ and variance σ²/n.
The derivation is short. The sum of n independent observations has mean nμ and, because variances of independent quantities add, variance nσ². Dividing the sum by n divides the mean by n and the variance by n². The independence assumption matters: if observations are positively correlated, as with subsamples from the same experimental unit, the true variance of the mean is larger than σ²/n, which is the mathematical reason pseudoreplication is so dangerous.
In practice σ is unknown and is replaced by the sample standard deviation s, giving the estimated standard error s/√n. This substitution adds a little extra uncertainty, which the t distribution of lesson 6 accounts for.
The central limit theorem
The fish lengths in the first simulation were normal, so it is not surprising that their means were normal too: sums and averages of normal variables are exactly normal. The remarkable fact is that sample means are approximately normal even when the original data are not. The central limit theorem (CLT) states that, for independent observations from any population with finite variance, the sampling distribution of the mean approaches a normal distribution as the sample size grows.
How large is large? It depends on how far the population is from normal. For roughly symmetric populations, samples of 10 or 15 give nearly normal means. For moderately skewed populations, 30 is a common rule of thumb. For very skewed populations, such as the lognormal contaminant concentrations of lesson 4 or counts with many zeros, much larger samples may be needed. The simulation below shows the CLT at work on a strongly right-skewed population.
import numpy as np
from scipy import stats
rng = np.random.default_rng(1515)

# A strongly right-skewed population: exponential waiting times with mean 10 minutes
def skew(x):
    return stats.skew(x)

print("Population skewness (exponential) = 2.00")
for n in (1, 5, 30, 100):
    means = rng.exponential(10, size=(20_000, n)).mean(axis=1)
    se = 10/np.sqrt(n)
    low = np.mean(means < 10 - 1.96*se)
    high = np.mean(means > 10 + 1.96*se)
    print(f"n = {n:3d}: skewness of means = {skew(means):5.2f}; "
f"below -1.96 SE: {low:.3f}, above +1.96 SE: {high:.3f}")Population skewness (exponential) = 2.00 n = 1: skewness of means = 2.02; below -1.96 SE: 0.000, above +1.96 SE: 0.052 n = 5: skewness of means = 0.86; below -1.96 SE: 0.000, above +1.96 SE: 0.043 n = 30: skewness of means = 0.35; below -1.96 SE: 0.015, above +1.96 SE: 0.033 n = 100: skewness of means = 0.20; below -1.96 SE: 0.019, above +1.96 SE: 0.031
Single observations from an exponential distribution have skewness 2; the means of 30 have skewness close to 0.35, and the means of 100 are nearly symmetric. The tail shares tell the same story. For a normal distribution, 2.5 percent of values lie more than 1.96 standard deviations below the mean and 2.5 percent lie the same distance above it. For single exponential observations, no value can fall that far below the mean (waiting times cannot be negative), while about 5 percent lie that far above it. The overall 95 percent coverage looks right only by coincidence: the two tails are badly unbalanced. As n grows, both tail shares move toward 0.025, which shows that the normal approximation can be poor for individual skewed observations even though it works well for means.
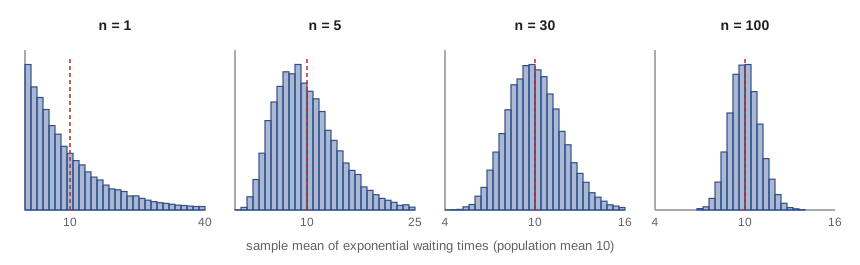
The CLT explains why the normal distribution is so common in nature as well as in statistics. Quantities that result from the sum of many small, independent effects, such as height, which depends on hundreds of genes and many environmental influences, tend to be approximately normal. BIOL-201 uses exactly this argument to explain why quantitative traits are bell-shaped.
The sampling distribution of a proportion
A sample proportion, p̂ = X/n, where X is the number of successes in n trials, is a special kind of mean: it is the mean of n observations each equal to 1 (success) or 0 (failure). From the binomial distribution of lesson 4, p̂ has mean p and standard error √(p(1 − p)/n). By the CLT, p̂ is approximately normal when n is large; a common guideline is that np and n(1 − p) should both be at least 10.
Worked problem
Germination in a batch of seeds
A supplier states that 85 percent of its seeds germinate. A grower plants 200 seeds and only 160 germinate. If the supplier is right, how unusual is a sample proportion this low?
Show solution
- p̂ = 160/200 = 0.80; p = 0.85; np = 170 and n(1 − p) = 30, both above 10, so the normal approximation is reasonable.
- SE = √(0.85 × 0.15 / 200) = √0.0006375 ≈ 0.0252.
- z = (0.80 − 0.85)/0.0252 ≈ −1.98.
- P(Z ≤ −1.98) ≈ 0.024.
Answer: If the supplier were right, a germination rate this low would occur in only about 2 to 3 percent of batches of 200, so the claim looks doubtful; lesson 7 formalizes this reasoning as a hypothesis test.
from scipy import stats
n, p, x = 200, 0.85, 160
se = (p*(1 - p)/n) ** 0.5
z = (x/n - p) / se
print(f"normal approximation: z = {z:.2f}, P(p-hat <= 0.80) = {stats.norm.cdf(z):.4f}")
print(f"exact binomial: P(X <= 160) = {stats.binom.cdf(x, n, p):.4f}")normal approximation: z = -1.98, P(p-hat <= 0.80) = 0.0238 exact binomial: P(X <= 160) = 0.0335
The normal approximation gives about 0.024 and the exact binomial calculation about 0.034. Both lead to the same practical conclusion, but the difference is a reminder that the approximation treats a discrete count as if it were continuous. With modern software, exact binomial probabilities are easy to compute and are preferable for small samples or proportions near 0 or 1, but the normal approximation remains useful for understanding and for quick calculations.
Sampling distributions of other statistics
Every statistic has a sampling distribution. The sample median, the standard deviation, a correlation coefficient and a regression slope all vary from sample to sample. Some have neat formulas; for others, statisticians use simulation. A useful comparison is between the mean and the median: for normal data, the median is also unbiased but has a standard error about 25 percent larger than the mean, so it is less efficient. For heavy-tailed data with occasional extreme values, the median can be more precise. This trade-off is one reason robust methods, introduced in lesson 2, are valuable.
import numpy as np
rng = np.random.default_rng(15105)
n, reps = 25, 20_000

normal = rng.normal(0, 1, size=(reps, n))
heavy = rng.standard_t(2, size=(reps, n))      # heavy-tailed data

for name, x in [("normal data", normal), ("heavy-tailed data", heavy)]:
    se_mean = x.mean(axis=1).std(ddof=1)
    se_median = np.median(x, axis=1).std(ddof=1)
print(f"{name:18s}: SE(mean) = {se_mean:.3f}, SE(median) = {se_median:.3f}")normal data : SE(mean) = 0.200, SE(median) = 0.250 heavy-tailed data : SE(mean) = 0.730, SE(median) = 0.288
Why the sample standard deviation divides by n − 1
Simulation also shows why lesson 2 used n − 1 in the sample variance. If we divide the sum of squared deviations by n, the result is too small on average, because the deviations are measured from the sample mean, which is always closer to the data than the true mean is. Dividing by n − 1 removes this bias exactly for the variance.
import numpy as np
rng = np.random.default_rng(15106)
sigma2 = 4.0
samples = rng.normal(0, 2, size=(50_000, 5))     # small samples of 5 make the bias obvious
print(f"true variance = {sigma2}")
print(f"average of variance with divisor n     = {samples.var(axis=1, ddof=0).mean():.3f}")
print(f"average of variance with divisor n - 1 = {samples.var(axis=1, ddof=1).mean():.3f}")true variance = 4.0 average of variance with divisor n = 3.193 average of variance with divisor n - 1 = 3.992
With samples of five, dividing by n underestimates the variance by about 20 percent, a factor of (n − 1)/n = 0.8, while dividing by n − 1 is correct on average. The square root, s, is still slightly biased downward as an estimate of σ, but the bias is small and is usually ignored.
Bias, precision and good estimators
A good estimator is close to the parameter it estimates. Two properties describe closeness. Bias is the difference between the estimator’s average value and the parameter; an unbiased estimator is right on average. Precision is the opposite of variability: a precise estimator has a small standard error. The mean squared error combines both: MSE = bias² + variance. Ideally an estimator has low bias and high precision, like arrows clustered on the center of a target. Larger samples improve precision but cannot remove bias from a flawed design, the point made in lesson 1 about samples of trees along roads.
Common mistakes
MistakeThe standard error describes how much individual observations vary.
InsteadThe standard deviation describes individual variation; the standard error describes how much a statistic such as the mean varies between samples.
MistakeThe central limit theorem says that large samples of data are normal.
InsteadIt says that the sampling distribution of the mean becomes approximately normal; the data themselves keep their original shape.
MistakeA sample of 30 is always large enough for the CLT.
InsteadVery skewed or heavy-tailed populations can need much larger samples; check the data and consider transformations or robust methods.
MistakeDoubling the sample size halves the standard error.
InsteadThe standard error falls with √n; halving it requires four times the sample size.
MistakeAn unbiased estimator is always close to the true value.
InsteadUnbiased means correct on average; a single estimate can still be far off if the estimator is imprecise.
Summary and key terms
- A sampling distribution describes how a statistic varies over all possible samples of the same size.
- The sample mean is unbiased for μ and has standard error σ/√n when observations are independent.
- The central limit theorem states that sample means are approximately normal for large n, whatever the population shape.
- More skewed populations need larger samples before the normal approximation is accurate.
- A sample proportion has mean p and standard error √(p(1 − p)/n), and is approximately normal when np and n(1 − p) are at least about 10.
- Other statistics, such as medians, have their own sampling distributions, which simulation can reveal.
- Good estimators combine low bias and high precision; dividing by n − 1 makes the sample variance unbiased.
- sampling distribution
- The distribution of a statistic over all possible samples of a given size.
- standard error
- The standard deviation of a statistic’s sampling distribution.
- unbiased estimator
- An estimator whose average over all samples equals the parameter.
- central limit theorem
- The result that sample means are approximately normal for large samples from any population with finite variance.
- sample proportion
- The fraction of successes in a sample, p̂ = X/n.
- efficiency
- The relative precision of two unbiased estimators of the same parameter.
- bias
- The difference between an estimator’s average value and the true parameter.
- precision
- The closeness of repeated estimates to each other; the inverse of variability.
- mean squared error
- Bias squared plus variance; the average squared distance from the true value.
- simulation
- Using a computer to generate many random samples to study the behavior of a statistic.
Practice problems
Work each problem on paper first, then reveal the answer to check.
A population has σ = 12. What is the standard error of the mean for n = 36?
Show answer
12/6 = 2.
A population has mean 50 and SD 10. Between which values will about 95 percent of means of samples of 25 lie?
Show answer
SE = 2; about 46 to 54.
Does the central limit theorem make the data normal? Explain.
Show answer
No; it makes the sampling distribution of the mean approximately normal, while individual observations keep their shape.
Why do very skewed populations need larger samples for the CLT?
Show answer
The skewness of the sample mean shrinks only as 1/√n, so a larger n is needed to make it small.
A true proportion is 0.3. What is the SE of p̂ for n = 100?
Show answer
√(0.3 × 0.7/100) ≈ 0.046.
Can the normal approximation be used for p = 0.02 and n = 100?
Show answer
No; np = 2 is well below 10, so use exact binomial methods.
In 400 trials with p = 0.5, find the probability that p̂ exceeds 0.55.
Show answer
SE = 0.025; z = 2; probability ≈ 0.023.
Why does dividing by n underestimate the population variance?
Show answer
Deviations are measured from the sample mean, which is closer to the data than the true mean, so they are too small on average.
Which is more precise for normal data, the mean or the median?
Show answer
The mean; the median’s standard error is about 25 percent larger.
A biased sampling method is used with n = 10,000. Is the estimate accurate?
Show answer
Not necessarily; it is precise but remains biased, because larger samples do not remove bias.
Lesson quiz · 5 questions
Score 60% or more to complete this lesson.
Create a free account to save your progress, take quizzes and earn a certificate.