
ROB-310 · Lesson 4 of 12 · 28 min
Sensor models
The correction step of the Bayes filter needs a measurement model, \( p(z_t \mid x_t) \): given that the robot is at state \( x_t \), how probable is the measurement it actually received? A good measurement model captures not only the sensor's random noise but also its failure modes: a lidar beam that passes through glass and returns the maximum range, a person who steps in front of the sensor, a reflection that produces a phantom wall. A model that knows only about Gaussian noise will be overwhelmed by these events; a model that expects them stays calm. This lesson develops the beam model and the likelihood field model for range sensors, the range-and-bearing model for landmarks, and the practical techniques that keep measurement updates robust.
What a measurement model must capture
Consider a single lidar beam pointed at a wall 4.0 m away. Most of the time it returns about 4.0 m, scattered by a centimeter or two of noise. Occasionally something unexpected, a person or a box not in the map, blocks the beam and it returns a shorter range. Sometimes the beam hits a black or shiny surface and no return is detected, so the sensor reports its maximum range. And now and then, for no identifiable reason, a reading is simply wrong. A measurement model that represents all of these is called a mixture model, because it mixes several simple distributions with weights that sum to 1. The weights and parameters are properties of the sensor and environment, and can be learned from logged data where the true pose is known.
The beam model
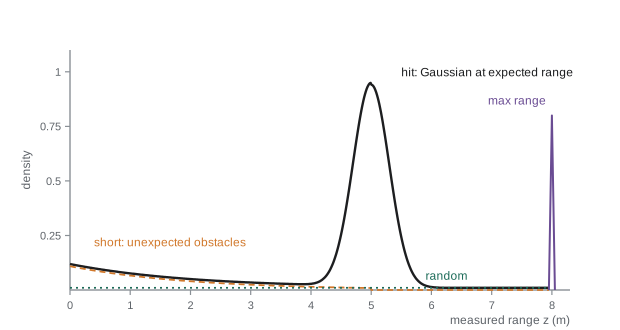
The beam model treats each range reading \( z^k \) in a scan independently given the pose. For a pose x and a map, the expected range \( z^{k*} \) is computed by ray casting: tracing the beam through the map until it hits an occupied cell. The likelihood of the actual reading is then a mixture of four parts:
\( p_{hit} \) is a Gaussian of standard deviation \( \sigma_{hit} \) centered on the expected range, truncated to the sensor's interval \( [0, z_{max}] \), representing correct readings with noise. \( p_{short} \) is an exponential distribution \( \lambda e^{-\lambda z} \) on \( [0, z^{k*}] \), representing unexpected objects, which are more likely to be detected close to the sensor because nearer objects block the beam first. \( p_{max} \) is a narrow spike at \( z_{max} \), representing missed returns. \( p_{rand} \) is uniform on \( [0, z_{max}] \), representing unexplained readings. The likelihood of the whole scan is the product over beams, \( p(z \mid x, m) = \prod_k p(z^k \mid x, m) \).
Worked problem
Evaluating the beam model
A beam has expected range 5.0 m, \( z_{max} \) = 8 m, \( \sigma_{hit} \) = 0.1 m and λ = 0.5 m⁻¹. Weights are \( w_{hit} \) = 0.75, \( w_{short} \) = 0.1, \( w_{max} \) = 0.05, \( w_{rand} \) = 0.1. Find the likelihood of readings of 5.05 m and 3.0 m, ignoring truncation corrections and treating the max spike as zero away from 8 m.
Show solution
- At 5.05 m: \( p_{hit} = \frac{1}{0.1\sqrt{2\pi}}e^{-0.5(0.5)^2} = 3.989 \times 0.8825 = 3.521 \).
- \( p_{short} = \frac{\lambda e^{-\lambda z}}{1 - e^{-\lambda z^*}} = \frac{0.5e^{-2.525}}{1 - e^{-2.5}} = \frac{0.0401}{0.918} = 0.0437 \); \( p_{rand} = 1/8 = 0.125 \).
- Total at 5.05 m: \( 0.75(3.521) + 0.1(0.0437) + 0.1(0.125) = 2.658 \).
- At 3.0 m: \( p_{hit} \approx 0 \) (20 standard deviations away); \( p_{short} = 0.5e^{-1.5}/0.918 = 0.1215 \); total \( 0.1(0.1215) + 0.1(0.125) = 0.0247 \).
Answer: The 5.05 m reading has likelihood 2.66 and the 3.0 m reading 0.025, about 100 times smaller but not zero. Without the short and random components, the 3.0 m reading would have likelihood \( \approx e^{-200} \), and one stray beam would wipe out an otherwise correct pose hypothesis.
The likelihood field model
The beam model is physically motivated but has two drawbacks. Ray casting is expensive, since every beam must be traced through the map for every pose hypothesis, which matters for particle filters with thousands of particles and scans of hundreds of beams. And the beam model's likelihood can change abruptly with tiny pose changes: a beam that just grazes a table leg in one pose and misses it in another flips between very different expected ranges, making the likelihood surface jagged. The likelihood field model, also called the end-point model, avoids both. It projects the end point of each beam into the map from the hypothesized pose and asks only how far that end point is from the nearest obstacle:
where \( \text{dist}_k \) is the distance from the projected end point to the closest occupied cell. Beams reporting maximum range are usually discarded. The distances can be precomputed once for every cell of the map with a distance transform, so evaluating a scan costs one table lookup per beam instead of a ray cast. The likelihood surface is smooth, which helps both particle filters and optimization-based scan matching. The price is that the model ignores free space: a beam that passes straight through a mapped wall to an obstacle behind it is not penalized, because only its end point is checked. In practice the speed and smoothness outweigh this, and the likelihood field is the default in most localization packages.
Worked problem
Likelihood field lookup
A beam end point lands 0.15 m from the nearest wall. With \( \sigma_{hit} \) = 0.1 m, \( w_{hit} \) = 0.9, \( w_{rand} \) = 0.1 and \( z_{max} \) = 10 m, find its likelihood, and compare with an end point exactly on the wall.
Show solution
- On the wall: \( 0.9 \times 3.989 + 0.1/10 = 3.590 + 0.010 = 3.600 \).
- At 0.15 m: Gaussian factor \( e^{-0.5(1.5)^2} = 0.3247 \); \( 0.9 \times 3.989 \times 0.3247 + 0.01 = 1.166 + 0.010 = 1.176 \).
- Ratio: \( 3.600/1.176 = 3.06 \).
Answer: The on-wall end point is about three times more likely than one 15 cm away. Over a 100-beam scan, a pose that puts every end point 15 cm off the walls is \( 3.06^{100} \approx 10^{48} \) times less likely than a perfectly aligned pose, which is why scan likelihoods must be handled in log form.
Landmark measurement models
Many robots localize against distinct landmarks: reflectors, fiducial markers such as AprilTags, poles, or features extracted from images. A landmark sensor typically reports range r and bearing φ to landmark j at known position \( (m_{j,x}, m_{j,y}) \). The expected measurement from pose \( (x, y, \theta) \) is
and the measurement model adds Gaussian noise: \( r \sim \mathcal{N}(\hat{r}, \sigma_r^2) \), \( \phi \sim \mathcal{N}(\hat{\phi}, \sigma_\phi^2) \). Bearing differences must be wrapped into \( (-\pi, \pi] \), a source of countless bugs: a measured bearing of 179° and an expected bearing of −179° differ by 2°, not 358°. The Jacobian of this model with respect to the pose, needed by the extended Kalman filter, has a simple form with \( q = \hat{r}^2 \), \( \Delta x = m_{j,x} - x \) and \( \Delta y = m_{j,y} - y \):
A complication is data association: the sensor may see a landmark without knowing which one it is. Landmarks with unique identities, such as coded fiducial markers, avoid the problem; identical reflectors require matching each detection to a map landmark, covered in lesson 11.
Worked problem
Expected range and bearing
A robot at (2, 1, 30°) observes a landmark at (6, 4). Find the expected range and bearing.
Show solution
- \( \Delta x = 4 \), \( \Delta y = 3 \); \( \hat{r} = 5 \) m.
- \( \operatorname{atan2}(3, 4) = 36.87° \).
- Bearing relative to heading: \( 36.87° - 30° = 6.87° \).
Answer: The landmark should appear 5 m away, 6.9° to the left of straight ahead. A measured bearing of 9.0° with \( \sigma_\phi \) = 1° would be 2.1 standard deviations off, plausible but suggesting a small heading error.
Independence, correlated errors and robustness
Multiplying beam likelihoods assumes their errors are independent given the pose. Real scans violate this badly: neighboring beams hitting the same unmapped object, or a map that is slightly misaligned, produce errors that are strongly correlated. A filter that multiplies 1,000 correlated beams as if they were independent becomes wildly overconfident, collapsing its belief on the basis of what is really much less information. Three remedies are standard. Subsampling uses only every tenth or every thirtieth beam, which both speeds computation and reduces correlation. Inflating \( \sigma_{hit} \) beyond the sensor's true noise accounts for map errors and correlation; values of 10 to 20 cm are common for lidars whose datasheet noise is 1 to 3 cm. And tempering raises the scan likelihood to a power less than 1, such as \( p(z \mid x)^{1/10} \), which in log form simply divides the summed log-likelihood.
import numpy as np
rng = np.random.default_rng(11)
def beam_loglik(z, zstar, zmax=8.0, s=0.1, lam=0.5, w=(0.75, 0.1, 0.05, 0.1)):
    ph = np.exp(-0.5*((z - zstar)/s)**2)/(s*np.sqrt(2*np.pi))
    ps = np.where(z <= zstar, lam*np.exp(-lam*z)/(1 - np.exp(-lam*zstar)), 0.0)
    pm = (z >= zmax - 1e-9).astype(float)
    pr = np.full_like(z, 1/zmax)
    return np.log(w[0]*ph + w[1]*ps + w[2]*pm + w[3]*pr)
zstar = np.full(60, 5.0)                       # 60 beams, all expecting 5 m
z = zstar + rng.normal(0, 0.03, 60)            # a good scan
z_bad = z.copy(); z_bad[:6] = 2.0              # a person blocks 6 beams
z_off = zstar + 0.15 + rng.normal(0, 0.03, 60) # pose 15 cm wrong
for name, scan in [("good", z), ("6 blocked", z_bad), ("15 cm off", z_off)]:
    print(f"{name:10s} log-likelihood = {beam_loglik(scan, zstar).sum():8.1f}")
print("with tempering 1/10, good vs 15 cm off differ by",
round((beam_loglik(z, zstar).sum() - beam_loglik(z_off, zstar).sum())/10, 1), "in log terms")good log-likelihood = 64.0 6 blocked log-likelihood = 37.0 15 cm off log-likelihood = -7.2 with tempering 1/10, good vs 15 cm off differ by 7.1 in log terms
The six blocked beams cost the correct pose 27 units of log-likelihood (64.0 down to 37.0), because the short-reading component explains them as unexpected obstacles, so the correct pose still scores far above the misaligned one at −7.2. The raw difference of about 71 between the good pose and the 15 cm error corresponds to odds of \( e^{71} \approx 10^{31} \), far beyond anything justified when beam errors are correlated; tempering by a factor of 10 reduces the difference to 7.1, odds of about 1,200 to 1, which is still decisive but leaves room for other evidence. Choosing these robustness settings is part of tuning any localization system, and lesson 12 returns to it with a consistency test.
Common mistakes
MistakeUsing a pure Gaussian model for range sensors
InsteadUse a mixture with short, max-range and random components so outliers do not destroy correct hypotheses.
MistakeMultiplying hundreds of raw beam likelihoods
InsteadWork in log form, subsample beams and inflate or temper to account for correlation.
MistakeForgetting to wrap bearing differences
InsteadWrap angle residuals into (−π, π] before computing likelihoods.
MistakeSetting σ_hit to the datasheet noise
InsteadInflate it to cover map errors, discretization and correlated beams.
MistakeAssuming landmark identities are known when they are not
InsteadTreat data association explicitly when landmarks look alike.
Summary and key terms
- A measurement model gives the likelihood of a reading for each possible state, including sensor failure modes.
- The beam model mixes a Gaussian hit, an exponential for unexpected obstacles, a max-range spike and a uniform floor.
- The likelihood field model scores each beam end point by its distance to the nearest obstacle, using a precomputed table.
- Likelihood fields are fast and smooth but ignore free space; beam models are physical but slow and jagged.
- Landmark models predict range and bearing, with Jacobians used by the extended Kalman filter.
- Bearing residuals must be wrapped, and data association must be handled when landmarks are not unique.
- Correlated beam errors are handled by subsampling, inflating noise and tempering the likelihood.
- Measurement model
- The distribution of a measurement given the state, p(z | x).
- Mixture model
- A weighted sum of simple distributions modeling different measurement causes.
- Ray casting
- Tracing a beam through a map to find the expected range.
- Beam model
- A range-sensor model mixing hit, short, max and random components per beam.
- Likelihood field
- A range-sensor model based on the distance from beam end points to obstacles.
- Distance transform
- A precomputed map of each cell's distance to the nearest obstacle.
- Range-bearing model
- A landmark model predicting distance and relative angle.
- Angle wrapping
- Mapping angle differences into a single 2π interval.
- Tempering
- Raising a likelihood to a power below 1 to reduce overconfidence.
- Data association
- Deciding which map feature caused a measurement.
Practice problems
Work each problem on paper first, then reveal the answer to check.
A beam expects 3 m but reads the maximum range. Which component explains it?
Show answer
\( p_{max} \).
Why is \( p_{short} \) an exponential rather than uniform?
Show answer
Nearer obstacles block the beam first, so short readings are more likely close to the sensor.
Robot at (0, 0, 90°), landmark at (0, 5). Expected bearing?
Show answer
\( 90° - 90° = 0° \).
Measured bearing 178°, expected −178°. What is the residual?
Show answer
−4° after wrapping (or 4° depending on sign convention).
With σ = 0.1 m, how much less likely is an end point 0.2 m off than one on a wall (Gaussian part)?
Show answer
\( e^{2} \approx 7.4 \) times.
Name two drawbacks of the beam model.
Show answer
Expensive ray casting and a jagged likelihood surface.
What does a likelihood field ignore?
Show answer
Free space along the beam.
Tempering by 1/5 changes a log-likelihood of −500 to?
Show answer
−100.
Why subsample a 1,000-beam scan?
Show answer
To save computation and reduce correlated errors.
What extra problem appears with identical reflectors?
Show answer
Data association.
Lesson quiz · 5 questions
Score 60% or more to complete this lesson.
Create a free account to save your progress, take quizzes and earn a certificate.