
PMP-130 · Lesson 11 of 12 · 26 min
Earned value management
Earned value management (EVM) integrates scope, schedule and cost to measure project performance objectively. Instead of asking only "how much have we spent?" or "are we on schedule?", it asks "how much of the planned work have we actually done, and what did it cost?" EVM gives early warning of trouble, supports forecasts of final cost and duration, and is a reliable source of calculation questions on the PMP exam. This lesson defines the three core measures, the variances and indices, the forecasting formulas and when to use each, the to-complete performance index, ways of measuring progress, earned schedule, and how to interpret results. CON-310 applies EVM to construction cost control in more depth; here the focus is on the PMP formulas and their interpretation.
The three core measures
Planned value (PV) is the authorized budget assigned to the work scheduled to be done by a given date. It is read from the time-phased cost baseline (the S-curve from lesson 10). Earned value (EV) is the budgeted value of the work actually completed by that date, measured using the budget for that work, not what it actually cost. Actual cost (AC) is the cost actually incurred for the work performed by that date. Budget at completion (BAC) is the total planned value for the project: the cost baseline total.
A simple way to remember them: PV is what we planned to have done, EV is what we actually did (in budget terms), and AC is what we paid for what we did. EV is the key: comparing EV with PV shows schedule performance, and comparing EV with AC shows cost performance. Comparing PV with AC directly is meaningless, because it mixes how much work was done with how much it cost.
Variances and indices
Variances express performance in money; indices express it as ratios, which are easier to compare across projects and over time.
| Measure | Formula | Interpretation |
|---|---|---|
| Schedule variance (SV) | EV − PV | Negative: behind schedule; positive: ahead |
| Cost variance (CV) | EV − AC | Negative: over budget; positive: under budget |
| Schedule performance index (SPI) | EV / PV | Below 1: behind schedule; above 1: ahead |
| Cost performance index (CPI) | EV / AC | Below 1: over budget; above 1: under budget |
A useful memory aid is that EV comes first in all four formulas, and that negative or below-1 is bad. CPI is often regarded as the most important single EVM measure, because research on large projects has found that cumulative CPI tends to stabilize early, once a project is about 20 % complete, and rarely improves dramatically afterwards. That finding comes mainly from large government projects, and it is a tendency, not a law, but it warns against assuming that a cost overrun will recover by itself.
# Earned value for Project Compass at the end of month 6 ($000, invented data)
BAC = 2400
PV_cum = [150, 360, 620, 900, 1180, 1440, 1700, 1940, 2180, 2400]   # cost baseline
EV_cum = [140, 330, 560, 820, 1060, 1290]
AC_cum = [150, 360, 610, 880, 1150, 1400]

print("Mon    PV    EV    AC    SV    CV   SPI   CPI")
for m, (ev, ac) in enumerate(zip(EV_cum, AC_cum), 1):
    pv = PV_cum[m - 1]
    print(f"{m:3d} {pv:5d} {ev:5d} {ac:5d} {ev - pv:5d} {ev - ac:5d} {ev / pv:5.2f} {ev / ac:5.2f}")

PV, EV, AC = PV_cum[5], EV_cum[-1], AC_cum[-1]
CPI, SPI = EV / AC, EV / PV
eacs = {
    "BAC / CPI (current cost performance continues)": BAC / CPI,
    "AC + (BAC - EV) (remaining work at planned rate)": AC + (BAC - EV),
    "AC + (BAC - EV) / (CPI x SPI) (cost and schedule)": AC + (BAC - EV) / (CPI * SPI),
    "AC + bottom-up ETC of 1,180": AC + 1180,
}
print()
for k, v in eacs.items():
    print(f"EAC {k}: {v:,.0f}  VAC {BAC - v:+,.0f}")
print(f"TCPI to meet BAC: {(BAC - EV) / (BAC - AC):.3f}")
print(f"TCPI to meet EAC of 2,560: {(BAC - EV) / (2560 - AC):.3f}")

# Earned schedule: when should the current EV have been earned?
k = max(i for i, pv in enumerate(PV_cum, 1) if pv <= EV)
ES = k + (EV - PV_cum[k - 1]) / (PV_cum[k] - PV_cum[k - 1])
print(f"Earned schedule {ES:.2f} months at actual time 6: SV(t) {ES - 6:+.2f}, SPI(t) {ES / 6:.3f}")
print(f"Forecast duration at SPI(t): {10 / (ES / 6):.1f} months (plan 10)")Mon PV EV AC SV CV SPI CPI 1 150 140 150 -10 -10 0.93 0.93 2 360 330 360 -30 -30 0.92 0.92 3 620 560 610 -60 -50 0.90 0.92 4 900 820 880 -80 -60 0.91 0.93 5 1180 1060 1150 -120 -90 0.90 0.92 6 1440 1290 1400 -150 -110 0.90 0.92 EAC BAC / CPI (current cost performance continues): 2,605 VAC -205 EAC AC + (BAC - EV) (remaining work at planned rate): 2,510 VAC -110 EAC AC + (BAC - EV) / (CPI x SPI) (cost and schedule): 2,745 VAC -345 EAC AC + bottom-up ETC of 1,180: 2,580 VAC -180 TCPI to meet BAC: 1.110 TCPI to meet EAC of 2,560: 0.957 Earned schedule 5.42 months at actual time 6: SV(t) -0.58, SPI(t) 0.904 Forecast duration at SPI(t): 11.1 months (plan 10)
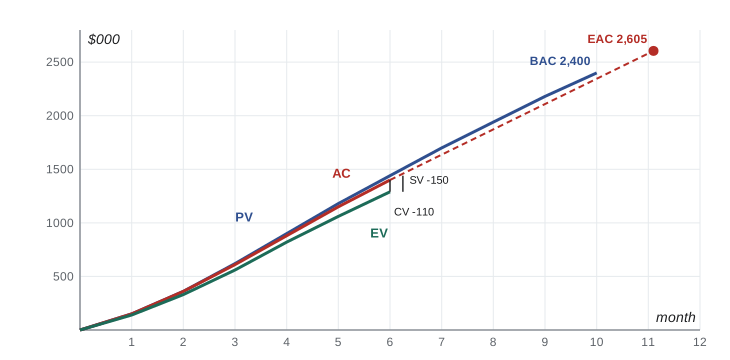
At the end of month 6, Project Compass planned to have done $1.44 million of work, has actually done $1.29 million of work and has spent $1.40 million. The schedule variance is −$150,000 and the SPI is 0.90: the project has achieved about 90 % of the work planned by now. The cost variance is −$110,000 and the CPI is 0.92: for every dollar spent, the project has earned about 92 cents of planned value. The monthly table shows both indices have been steady at about 0.90 to 0.93 since month 1, suggesting a consistent pattern rather than a one-off problem.
Forecasting: EAC, ETC and VAC
The estimate at completion (EAC) is the expected total cost of the project when complete. The estimate to complete (ETC) is the expected cost of the remaining work, so EAC = AC + ETC. The variance at completion (VAC) is BAC − EAC: a negative VAC means the project is expected to finish over budget. There are several ways to calculate EAC, each based on a different assumption about future performance. Choosing the right one is a common exam skill.
| Formula | Assumption | Project Compass ($000) |
|---|---|---|
| EAC = BAC / CPI | Cost performance to date will continue (the most common default) | 2,605 |
| EAC = AC + (BAC − EV) | Past variance was atypical; remaining work will be done at the budgeted rate | 2,510 |
| EAC = AC + (BAC − EV) / (CPI × SPI) | Both cost and schedule performance will affect the remaining work, for example when the schedule must be recovered | 2,745 |
| EAC = AC + bottom-up ETC | The original plan is no longer valid; re-estimate the remaining work | 2,580 |
In the exam, the scenario tells you which assumption applies. If it says the variances are expected to continue, or gives no reason to think otherwise, use BAC / CPI. If it says a one-time problem caused the overrun and it will not recur, use AC + (BAC − EV). If it says the project must meet a fixed date and both indices matter, use the CPI × SPI version. If it says the original estimates were fundamentally flawed, re-estimate. For Project Compass, the overrun comes from consistently higher construction unit costs and slower tagging, so the team believes the pattern will continue. BAC / CPI gives about $2.6 million, and the team's bottom-up re-estimate of $2.58 million is close, which increases confidence.
The to-complete performance index
The to-complete performance index (TCPI) is the cost performance that must be achieved on the remaining work to meet a specified goal. It is the ratio of the work remaining to the funds remaining.
For Project Compass, finishing within the original $2.4 million would require a CPI of 1.110 on all remaining work, compared with the 0.92 achieved so far. That is unrealistic. A TCPI significantly above the current CPI, especially above about 1.1 when the cumulative CPI is below 1, is a signal that the original budget will not be met without major changes. If the board approves a revised target of $2.56 million, the required CPI falls to 0.957, which is achievable with modest improvement. TCPI turns a forecast into a performance target the team can understand.
Worked problem
Interpreting a status report
At a later status date, a different project reports BAC $500,000, PV $250,000, EV $200,000 and AC $180,000. Interpret the results and forecast the final cost assuming current performance continues.
Show solution
- SV = 200,000 − 250,000 = −$50,000; SPI = 0.80: behind schedule, with 80 % of planned work done.
- CV = 200,000 − 180,000 = +$20,000; CPI = 1.11: under budget for the work done.
- EAC = BAC / CPI = 500,000 / 1.111 = $450,000; ETC = 450,000 − 180,000 = $270,000; VAC = +$50,000.
- Look for the cause: being under budget and behind schedule may simply mean fewer resources are working than planned, so the cost advantage may disappear when the schedule is recovered.
Answer: Behind schedule and under budget, with an EAC of about $450,000. The pattern suggests understaffing, so the project manager should check resourcing before celebrating the cost variance.
Measuring earned value
EV is only as good as the method used to measure progress. Common methods include the following.
| Method | How EV is credited | Suitable for |
|---|---|---|
| 0/100 | Nothing until complete, then full value | Short work packages within one reporting period |
| 50/50 (or 20/80) | Half (or a set share) at start, the rest at completion | Work packages spanning two periods |
| Weighted milestones | Set shares when defined milestones are reached | Longer work packages with clear intermediate points |
| Physical percent complete | Measured proportion of work done | Measurable quantities, such as items tagged or meters of cable installed |
| Units completed | Budget per unit × units completed | Repetitive work, such as kiosks installed |
| Level of effort | EV equals PV automatically | Support work with no measurable output, such as project management (use sparingly) |
| Apportioned effort | A share of a related discrete work package's EV | Inspection or supervision tied to production |
Subjective percent complete estimates ("about 80 % done") are notoriously unreliable: work often sits at 90 % for a long time. Objective methods, based on observable milestones or quantities, give better EV. Level of effort should be limited to genuine support work, because it always reports SV = 0 and can hide problems if overused.
Earned schedule
SV and SPI have a known weakness: they are expressed in money, not time, and at the end of a late project, EV eventually equals PV (all work is done, all planned value earned), so SV returns to zero and SPI to 1 even though the project finished late. Earned schedule (ES) addresses this. It finds the time at which the current EV should have been earned according to the baseline, then compares that with actual time (AT). Schedule variance in time is SV(t) = ES − AT, and SPI(t) = ES / AT.
For Project Compass, an EV of $1.29 million should have been earned at about 5.42 months according to the baseline, but the actual time is 6 months. SV(t) is −0.58 months, about two and a half weeks, and SPI(t) is 0.904. Dividing the planned duration by SPI(t) forecasts about 11.1 months instead of 10. Earned schedule is not universally used, but the PMBOK Guide and practice standards recognize it, and it gives a more intuitive answer to "how late are we?". Treat any EVM-based duration forecast as a cross-check on the critical path analysis, not a substitute for it, because EVM does not know which work is critical.
Interpreting and acting on EVM
EVM figures are indicators, not explanations. A poor CPI could come from higher prices, lower productivity, rework, poorly measured EV or costs recorded in the wrong period. A poor SPI could come from late starts on non-critical work that will not affect the finish, or from critical delays that will. Always look behind the numbers, at control account level, before deciding what to do.
Thresholds help. Many organizations set variance thresholds, for example CPI or SPI below 0.95 triggers an analysis and below 0.90 triggers escalation. When a threshold is crossed, the project manager investigates the cause, considers corrective actions such as resequencing work, improving productivity or renegotiating supplier prices, updates forecasts and reports honestly. If the forecast exceeds the budget and reserves, a change request may be needed to rebaseline, with the sponsor's approval.
For Project Compass, the project manager reports a CPI of 0.92 and SPI of 0.90 to the board, explains that construction unit costs are higher than estimated and tagging is slower than the pilot suggested, forecasts an EAC of about $2.6 million, and notes that the remaining contingency and management reserve may not cover the full overrun. She recommends a third encoding station to speed tagging, value engineering on remaining finishes, and a decision by the board on whether to fund a revised budget. PMP-121 showed how to present such figures in plain language to stakeholders.
Common mistakes
MistakeComparing PV with AC to judge cost performance.
InsteadCompare EV with AC; compare EV with PV for schedule.
MistakeUsing BAC / CPI when the scenario says the variance was a one-off.
InsteadChoose the EAC formula that matches the stated assumption about future performance.
MistakeIncluding management reserve in BAC.
InsteadBAC is the cost baseline total, excluding management reserve.
MistakeRelying on subjective percent complete for EV.
InsteadUse objective methods such as weighted milestones or units completed.
MistakeTreating SPI of 1 at project end as proof of on-time delivery.
InsteadUse earned schedule or the actual finish date; SPI returns to 1 when all work is done.
Summary and key terms
- PV is planned work, EV is work done at budgeted cost, AC is actual cost; BAC is the cost baseline total.
- SV = EV − PV; CV = EV − AC; SPI = EV / PV; CPI = EV / AC. Negative or below 1 is unfavorable.
- EAC = BAC / CPI if performance continues; AC + (BAC − EV) if variance was atypical; AC + (BAC − EV)/(CPI × SPI) if both matter; AC + ETC if re-estimated.
- ETC = EAC − AC; VAC = BAC − EAC.
- TCPI = (BAC − EV)/(BAC − AC) or (BAC − EV)/(EAC − AC): the efficiency needed on remaining work.
- Measure EV objectively; use level of effort sparingly.
- Earned schedule expresses schedule performance in time; always investigate causes behind EVM figures.
- Planned value
- The authorized budget assigned to scheduled work.
- Earned value
- The measure of work performed expressed in terms of the budget authorized for that work.
- Actual cost
- The realized cost incurred for the work performed in a given period.
- Schedule performance index
- A measure of schedule efficiency, EV / PV.
- Cost performance index
- A measure of cost efficiency, EV / AC.
- Estimate at completion
- The expected total cost of completing all work.
- Estimate to complete
- The expected cost to finish all remaining work.
- Variance at completion
- The projected budget deficit or surplus, BAC − EAC.
- To-complete performance index
- The cost performance that must be achieved on remaining work to meet a specified goal.
- Earned schedule
- The time at which the current earned value should have been achieved according to the baseline.
Practice problems
Work each problem on paper first, then reveal the answer to check.
PV 100, EV 90, AC 120. SV and CV?
Show answer
SV = −10; CV = −30.
Same figures: SPI and CPI?
Show answer
SPI = 0.90; CPI = 0.75.
BAC 400 with CPI 0.80. EAC if performance continues?
Show answer
500.
BAC 400, AC 150, EV 120; variance was a one-off. EAC?
Show answer
150 + (400 − 120) = 430.
BAC 400, EV 120, AC 150. TCPI to meet BAC?
Show answer
(400 − 120) / (400 − 150) = 280 / 250 = 1.12.
EAC 500, AC 150. ETC?
Show answer
350.
BAC 400, EAC 500. VAC?
Show answer
−100.
Which EV method gives no credit until a work package is finished?
Show answer
0/100.
Why limit the use of level of effort?
Show answer
It always shows EV = PV, so it can hide schedule problems.
EV equals the planned value for month 4.5; actual time is month 5. SV(t)?
Show answer
−0.5 months.
Lesson quiz · 5 questions
Score 60% or more to complete this lesson.
Create a free account to save your progress, take quizzes and earn a certificate.