
PET-450 · Lesson 3 of 12 · 19 min
Volumetric estimates and probabilistic ranges
The north flank of the Tamarack Lake field has three vertical wells with logs and one short horizontal test, but no development wells. Before Graham will consider any reserves there, he wants to know how much oil could be in place and how uncertain that number is. Grace Nakoochee, the geologist who mapped the flank, brings Ethan her structure and net pay maps, and together they build a volumetric estimate. Volumetric methods are the first estimates made for any accumulation and remain the main method wherever there is too little production history for decline analysis or material balance. This lesson covers the volumetric equation, the choice of inputs, and the probabilistic methods that turn uncertain inputs into the P90, P50 and P10 values used in Lesson 2.
The volumetric equation
The original oil in place is the pore volume of the reservoir that contains oil, converted to stock-tank conditions with the formation volume factor:
where N is the oil in place in stock-tank barrels, A is the area in acres, h is net pay in feet, φ is porosity, S_w is water saturation and B_o is the oil formation volume factor in reservoir barrels per stock-tank barrel. The constant 7,758 is the number of barrels in one acre-foot. For gas, the same pore volume, using 43,560 cubic feet per acre-foot, is divided by the gas formation volume factor B_g to give the gas initially in place.
Recoverable volume is the oil in place multiplied by a recovery factor, which depends on the drive mechanism, the development plan and the economics. For the north flank, which would be developed with multi-stage fractured horizontals like the rest of the pool, Grace and Ethan use the recovery factors observed in the developed part of the pool, adjusted for the thinner pay. Recovery factors carry at least as much uncertainty as the oil in place, and for tight reservoirs they are often the larger source of error.
Choosing the inputs
Each input comes from a different source and carries a different kind of uncertainty. The area comes from a structure map and the limits of the accumulation: an oil-water contact, a pinch-out of the sand, a fault, or simply the edge of the company's land. Net pay comes from an isopach map built from log picks using cutoffs on porosity, shale volume and water saturation, so a change of cutoff can change the pay substantially. Porosity comes from density and neutron logs calibrated to core. Water saturation comes from resistivity logs through the Archie equation of PET-350, and is sensitive to the cementation and saturation exponents. The formation volume factor comes from PVT analysis.
Inputs are not independent. Better-quality rock usually has both higher porosity and lower water saturation, so treating them as independent overstates the chance of combinations such as high porosity with high saturation. Thicker pay is often found where porosity is better. An evaluation should either model these dependencies or, at least, check that the combinations it samples are geologically reasonable. The geologist's judgment matters most for the area and net pay, which in a new area are the largest sources of uncertainty.
For the north flank, Grace's maps give an area between 2,000 and 3,200 acres with 2,560 acres most likely, four sections. Net pay ranges from 28 to 52 feet with 40 feet most likely, porosity from 6 to 10 percent, and water saturation from 30 to 45 percent. The formation volume factor is 1.40, from the PVT report, and the recovery factor ranges from 6 to 10 percent with 8 percent most likely.
Deterministic and probabilistic estimates
There are two ways to express the uncertainty in a volumetric estimate. The deterministic or scenario approach builds three self-consistent cases, low, best and high, each with its own map and set of inputs. It is transparent and easy to review, and each case can be tied to a geological story, but it is hard to say exactly what probability each case represents. Multiplying all the low inputs together, for example, gives a value far below any realistic P90, because it is very unlikely that every input is at its low end at once.
The probabilistic approach describes each input by a probability distribution and combines them by Monte Carlo simulation. In each trial the program draws one value of each input at random, computes the oil in place and the recoverable volume, and stores the result. After many thousands of trials the stored results form a distribution from which percentiles can be read. Triangular distributions, defined by a minimum, most likely and maximum, are common because they are easy to explain; lognormal distributions are often better for quantities such as area and permeability that are positive and right-skewed.
Reserves practice uses exceedance probabilities. The P90 is the value that the outcome is expected to equal or exceed with 90 percent probability, which is the low estimate; the P10 is the high estimate. This is the opposite of the usual statistical convention, in which the 90th percentile is a high value, so it is worth stating the convention on every chart.
# Volumetric oil in place for the north flank, deterministic and by Monte Carlo, with P90/P50/P10.
import random, math
SI = False     # True: metric (ha, m, m3), False: oilfield (acres, ft, STB)
random.seed(450)
if SI:
    A = (800.0, 1036.0, 1300.0)    # area, ha: low, most likely, high (triangular)
    h = (4.0, 6.0, 8.5)            # net pay, m
    conv = 1e4                     # m2 per ha
    unit = "million m3"; scale = 1e6
else:
    A = (2000.0, 2560.0, 3200.0)   # area, acres
    h = (28.0, 40.0, 52.0)         # net pay, ft
    conv = 7758.0                  # bbl per acre-ft
    unit = "MMSTB"; scale = 1e6
phi = (0.09, 0.12, 0.14) if SI else (0.06, 0.08, 0.10)
sw = (0.25, 0.30, 0.40) if SI else (0.30, 0.35, 0.45)
bo = 1.25 if SI else 1.40
rf = (0.07, 0.10, 0.13) if SI else (0.06, 0.08, 0.10)

def ooip(a, hh, p, s): return conv * a * hh * p * (1 - s) / bo
det = ooip(A[1], h[1], phi[1], sw[1])
print(f"deterministic OOIP (most likely inputs) {det / scale:.2f} {unit}, recoverable {det * rf[1] / scale:.2f}")
tri = lambda t: random.triangular(t[0], t[2], t[1])
N = 20000; vals = []; rec = []
for _ in range(N):
    v = ooip(tri(A), tri(h), tri(phi), tri(sw)); vals.append(v); rec.append(v * tri(rf))
vals.sort(); rec.sort()
pct = lambda xs, p: xs[int((1 - p) * len(xs))]      # P90 = value exceeded with 90 percent probability
for name, xs in (("OOIP", vals), ("recoverable", rec)):
    print(f"{name:12s} P90 {pct(xs, 0.9) / scale:5.2f}  P50 {pct(xs, 0.5) / scale:5.2f}  P10 {pct(xs, 0.1) / scale:5.2f}  mean {sum(xs) / N / scale:5.2f} {unit}")
print(f"P10/P90 ratio for recoverable volume {pct(rec, 0.1) / pct(rec, 0.9):.2f}")deterministic OOIP (most likely inputs) 29.51 MMSTB, recoverable 2.36 OOIP P90 22.23 P50 28.72 P10 36.61 mean 29.13 MMSTB recoverable P90 1.70 P50 2.28 P10 3.03 mean 2.33 MMSTB P10/P90 ratio for recoverable volume 1.78
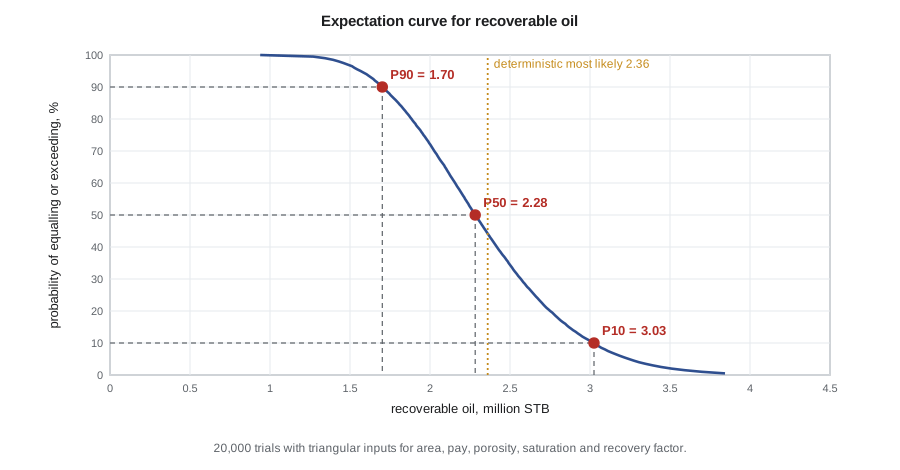
The deterministic calculation with the most likely value of every input gives 29.5 million barrels in place and 2.36 million recoverable. The Monte Carlo results are a P90 of 1.70, a P50 of 2.28 and a P10 of 3.03 million barrels recoverable, with a mean of 2.33. Two observations are general. The P50 is a little below the deterministic result, because the product of most likely values is not the most likely product when the distributions are skewed. And the P10 to P90 ratio of 1.78 is a compact measure of the uncertainty; mature producing areas typically show ratios close to 1, while frontier prospects can exceed 10.
Worked problem
A deterministic volumetric check
Using the most likely inputs, A = 2,560 acres, h = 40 ft, φ = 0.08, S_w = 0.35 and B_o = 1.40, compute the oil in place and the recoverable volume at 8 percent recovery.
Show solution
- Bulk volume: 2,560 × 40 = 102,400 acre-ft.
- Hydrocarbon pore volume: 7,758 × 102,400 × 0.08 × 0.65 = 41.3 million reservoir bbl.
- Oil in place: 41.3 / 1.40 = 29.5 million STB.
- Recoverable: 0.08 × 29.5 = 2.36 million STB.
Answer: The hand calculation reproduces the deterministic line of the script, which is a useful check on any Monte Carlo model before it is run.
Good practice in probabilistic estimates
A Monte Carlo model is only as good as its input distributions, and several practices keep it honest. The ranges should be wide enough to include outcomes that have surprised similar projects in the past; studies of exploration and development projects consistently find that estimated ranges are too narrow. The distributions should represent uncertainty in the average property over the area, not the variability between individual samples: porosity may vary from 4 to 18 percent between core plugs, but the uncertainty in the average porosity of four sections is much smaller. Dependencies between inputs should be included, and the model should be run with enough trials for the percentiles to be stable, which for a simple model is a few thousand.
The results should also be checked against the deterministic cases and against analogs. If the P90 is higher than the volume a geologist would accept as a realistic low case, or the P10 is beyond any analog field, the inputs need revisiting. Finally, the probabilistic result describes a range for the accumulation as a whole. Booking reserves requires a development project with wells and facilities, so only the part of the volume that the project would drain can be counted, and the categories must still meet the definitions of Lesson 2.
For the north flank this distinction matters. The P50 recoverable volume is about 2.3 million barrels, but the six locations that the company plans to drill would drain only part of the area, and they are beyond the distance at which Graham can accept continuity with reasonable certainty. He accepts about 990 thousand boe as probable undeveloped reserves for those six locations, which do not appear in the 10-K, and the rest of the volume is not yet tied to a defined project. The volumetric work has nevertheless done its job: it shows that the flank can support a development program and tells the company what an appraisal well needs to find out.
Volumetrics for gas and for undeveloped areas
For gas reservoirs the volumetric estimate of gas in place can be compared with material balance once production begins. In the Birch Coulee gas pool, the p/z plot of PET-320 has confirmed the volumetric gas in place to within a few percent, so Graham is comfortable with a high recovery factor of about 80 percent for that depletion-drive pool. Where the two methods disagree, the evaluator must decide which to trust; material balance with good pressure data usually wins, because it measures the volume actually connected to the wells.
For undeveloped areas the volumetric method has a specific weakness: it says how much oil is in place but not how fast it will flow or how much each well will recover. In tight and unconventional plays the recovery per well depends far more on completion design and well spacing than on the volume in place, so evaluators rely on type curves from producing wells, the subject of Lesson 5. Volumetric estimates remain essential there as a check: the total recovery from a proposed set of wells should be a plausible fraction of the oil in place within their drainage areas.
Documenting a volumetric estimate
Graham asks for the north flank work to be documented so that someone else could repeat it. The record lists the maps and their versions, the log cutoffs and the wells used, the source of each distribution and the reason for its shape, the dependencies included, the number of trials and the random seed, and the results with the deterministic check. It also states what would change the estimate most: here, an appraisal well that confirms or narrows the net pay and a pressure test that shows whether the flank is connected to the developed part of the pool. A volumetric estimate that cannot be reproduced from its documentation will not survive an audit, however good the geology behind it.
Common mistakes
MistakeMultiplying all low or all high inputs to get P90 and P10.
InsteadCombine distributions by simulation or build consistent scenarios; the product of extreme inputs is far more extreme than P90 or P10.
MistakeUsing sample-to-sample variability as the uncertainty in an average property.
InsteadUse the uncertainty in the area-wide average, which is narrower.
MistakeTreating porosity, saturation and pay as independent when they are correlated.
InsteadModel the dependencies or check that sampled combinations are reasonable.
MistakeBooking the whole volumetric P50 as reserves.
InsteadOnly volumes drained by a defined, committed project can be reserves.
Summary and key terms
- Oil in place is the hydrocarbon pore volume divided by the formation volume factor; recovery factor converts it to recoverable volume.
- Area and net pay usually dominate the uncertainty in new areas; recovery factor dominates in tight reservoirs.
- Deterministic scenarios are transparent; probabilistic methods give explicit percentiles.
- Reserves use exceedance probabilities: P90 is the low estimate and P10 the high estimate.
- Ranges should reflect uncertainty in averages, include dependencies and be checked against analogs.
- Only the part of a volume drained by a committed project can be booked as reserves.
- Oil in place
- The total volume of oil in the reservoir, at stock-tank conditions, before production.
- Recovery factor
- The fraction of oil in place expected to be recovered by a project.
- Net pay
- The thickness of reservoir rock that meets cutoffs for porosity, shale and saturation.
- Monte Carlo simulation
- Repeated random sampling of input distributions to build a distribution of the result.
- Exceedance probability
- The probability that the outcome will equal or exceed a stated value.
- Expectation curve
- A plot of exceedance probability against value.
- P10/P90 ratio
- A measure of the width of an uncertainty range.
Practice problems
Work each problem on paper first, then reveal the answer to check.
In a Monte Carlo run of 10,000 trials sorted from smallest to largest, which result is the P90?
Show answer
The 1,000th smallest: 90 percent of results are equal to or larger than it.
Why is the P50 often slightly below the deterministic most likely result?
Show answer
With skewed input distributions, the product of most likely values is not the median of the product.
Name two input dependencies a volumetric model should consider.
Show answer
Porosity and water saturation (negative), porosity and net pay (often positive).
Why are volumetric estimates less useful for predicting recovery per well in tight reservoirs?
Show answer
Recovery depends mainly on completion and spacing; type curves from producing wells are better.
Lesson quiz · 5 questions
Score 60% or more to complete this lesson.
Create a free account to save your progress, take quizzes and earn a certificate.