
PET-380 · Lesson 5 of 12 · 19 min
Flow patterns in vertical pipes
Before he goes further along the gathering line, Sofia sends Ethan back to the beginning of the flow path: the tubing of the 3-22H well. Marisol Vega, his former mentor in production, has a question for him. The well's flowing bottomhole pressure, measured with a gauge last month, is about fifty psi higher than the nodal analysis model predicted. 'The model assumes bubble flow all the way up,' Marisol says. 'I am not sure that is right in the top half of the tubing. Can you work out what the flow pattern really is?'
This lesson describes the flow patterns of upward gas-liquid flow in vertical and steeply inclined pipes: bubble, slug, churn and annular flow. It explains the mechanisms behind the transitions, introduces the Duns-Ros and Taitel-Barnea-Dukler maps, and shows why the pattern changes from bottom to top in a producing well.
The vertical flow patterns
In a vertical pipe gravity acts along the axis, so the patterns are roughly symmetric about the center. At low gas rates the gas is dispersed as small bubbles in a continuous liquid. This is bubble flow. The bubbles rise relative to the liquid at a velocity that depends on their size and the density difference, typically about 0.15 to 0.25 m/s (0.5 to 0.8 ft/s), so they slip past the liquid.
As the gas rate increases, bubbles collide and coalesce into large bullet-shaped bubbles, called Taylor bubbles, that nearly fill the pipe. They are separated by liquid slugs that contain small bubbles, and a thin liquid film runs down the wall around each Taylor bubble. This is slug flow. The Taylor bubbles rise faster than the mixture by a drift velocity of about 0.35√(gD), which in typical tubing is a few tenths of a meter per second.
At still higher gas rates the Taylor bubbles become unstable and break up, and the liquid slugs are repeatedly destroyed and re-formed. The flow becomes chaotic and frothy, with liquid moving up and down. This is churn flow, a transitional pattern that is hard to model and often grouped with slug flow. Finally, when the gas is fast enough to carry the liquid film up the wall, the flow becomes annular: a gas core with droplets surrounded by a liquid film that moves upward. Annular flow is typical in gas wells and gas-condensate wells.
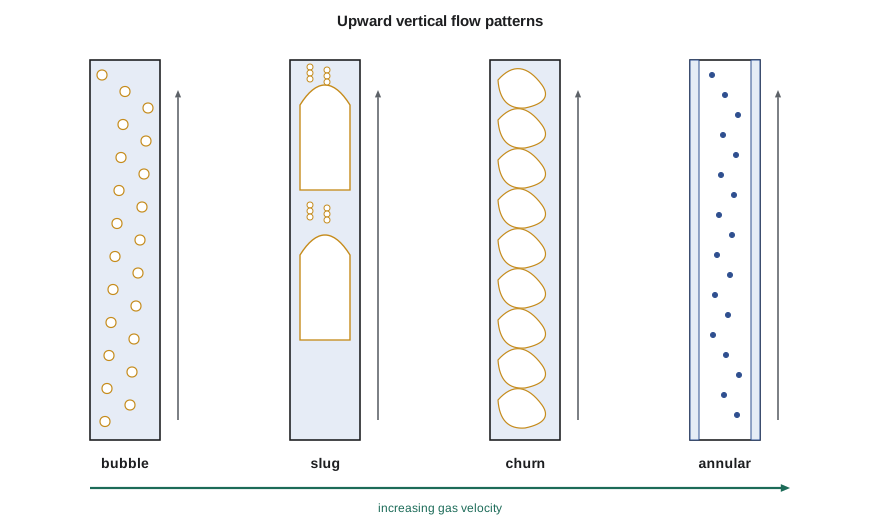
Why the pattern changes up a well
In a flowing oil well, the pattern usually changes with depth. Near the bottom, if the flowing pressure is above the bubble point, there is no free gas and the flow is single-phase liquid. Above the depth where pressure falls through the bubble point, gas comes out of solution as small bubbles, giving bubble flow. As the fluid rises, pressure falls further, more gas comes out of solution, and the free gas expands. The superficial gas velocity can increase several-fold between the bubble point depth and the wellhead. The flow passes from bubble to slug, often to churn, and in high gas-oil ratio wells to annular flow near the top.
Each pattern has a different holdup and friction behavior. In bubble flow, slip is small and the mixture density is close to the no-slip value. In slug flow, slip is larger and holdup is well above the no-slip fraction. In annular flow, holdup falls and friction becomes important because the gas core is fast. A model that assumes the wrong pattern over a large part of the tubing can be wrong by tens of percent in bottomhole pressure, which is exactly Marisol's problem.
The Duns-Ros map
Duns and Ros, working at Shell's laboratory in the Netherlands in the early 1960s, carried out thousands of vertical flow experiments and presented a map based on dimensionless gas and liquid velocity numbers. These scale the superficial velocities by the liquid density and surface tension:
Their map divides the plane into three main regions: region I, with a continuous liquid phase (bubble and plug flow); region II, alternating phases (slug flow); and region III, a continuous gas phase (mist or annular flow), with a transition zone between II and III. The velocity numbers reappear in the Hagedorn-Brown and Beggs-Brill correlations discussed in lesson 7.
Taitel-Barnea-Dukler transitions
Taitel, Barnea and Dukler, in 1980, derived the vertical transitions from physical arguments. Bubble flow changes to slug flow when the gas void fraction reaches about 0.25, because bubbles then collide often enough to coalesce. Using the bubble rise velocity, this gives a boundary in terms of superficial velocities. Bubble flow can exist at low liquid rates only in pipes larger than a critical diameter, which for typical oil and water is a few centimeters. At high liquid rates, turbulence breaks large bubbles into small ones, giving dispersed bubble flow even at higher gas fractions.
The transition to annular flow occurs when the gas is fast enough to hold the largest liquid droplets suspended against gravity. Above that velocity, liquid that falls back from the film is swept up again and the film can be carried upward. The result is a critical superficial gas velocity that depends on the gas density, the liquid density and the surface tension, but not on the pipe diameter:
This is closely related to the Turner criterion for liquid loading in gas wells, which Ethan met in production engineering and which lesson 11 revisits: a gas well whose velocity falls below roughly this value can no longer lift its liquid.
# Vertical upward flow: simplified Taitel-Barnea-Dukler transitions for an oil-gas mixture in 2-7/8 in tubing
import math
SI = False
g = 9.81
D = 0.062                        # m, tubing inside diameter
rhoL, rhoG, sig = 820.0, 25.0, 0.025    # kg/m3, kg/m3, N/m
U = (g * (rhoL - rhoG) * sig / rhoL ** 2) ** 0.25          # bubble rise velocity scale, m/s
ann = 3.1 * (sig * g * (rhoL - rhoG)) ** 0.25 / math.sqrt(rhoG)   # gas velocity needed to carry a film upward
def regime(vsl, vsg):
    if vsg >= ann: return "annular"
    if vsl > 3.0 * vsg - 1.15 * U and D > 19.01 * math.sqrt((rhoL - rhoG) * sig / (rhoL ** 2 * g)):
        return "bubble"
    return "slug or churn"
f = 1 if SI else 3.2808; u = "m/s" if SI else "ft/s"
print(f"bubble-rise scale 1.15*U = {1.15 * U * f:4.2f} {u}; annular threshold vSG = {ann * f:4.1f} {u}")
for vsl, vsg in ((1.0, 0.1), (0.5, 0.5), (0.3, 3.0), (0.1, 6.0), (0.05, 15.0)):
print(f"vSL {vsl * f:5.2f}, vSG {vsg * f:5.2f} {u}: {regime(vsl, vsg)}")bubble-rise scale 1.15*U = 0.49 ft/s; annular threshold vSG = 7.6 ft/s vSL 3.28, vSG 0.33 ft/s: bubble vSL 1.64, vSG 1.64 ft/s: slug or churn vSL 0.98, vSG 9.84 ft/s: annular vSL 0.33, vSG 19.68 ft/s: annular vSL 0.16, vSG 49.21 ft/s: annular
Ethan's code gives an annular threshold of about 7.6 ft/s of superficial gas velocity at the gas density near the top of the well, and shows the pattern moving from bubble to slug or churn to annular as the gas velocity rises. When he applies it to the 3-22H well's measured rates, he finds that above about 3,900 ft depth the superficial gas velocity exceeds the bubble-to-slug boundary, so the upper half of the tubing is in slug and churn flow, not bubble flow. 'That explains the error,' Marisol says. 'The bubble flow model underestimated the holdup in the top half.'
Deviated and horizontal wells
Most new wells in the Tamarack Lake field are horizontal, so the flow path includes a long near-horizontal lateral, a curved build section and a vertical or near-vertical upper section. In the lateral the patterns resemble those of horizontal pipes, with stratified and slug flow; small undulations in the lateral trajectory can trap liquid in low spots and gas in high spots. In the build section, at inclinations of 30 to 70 degrees from vertical, slug flow is common and holdup can be higher than in either vertical or horizontal flow, because the liquid film runs back down the low side of the pipe while gas rises along the high side. Correlations developed for vertical wells perform poorly here, which is one reason mechanistic models are preferred for deviated wells.
Downward vertical flow
Downward two-phase flow occurs in injection wells, in the downcomer legs of some facility piping and in gas-lift injection with liquid present. Its patterns differ from upward flow: the liquid tends to form a falling film on the wall with gas in the core, and holdup is generally lower than the no-slip fraction because gravity helps the liquid. Few gathering systems include long downward vertical sections, but designers should not apply upward-flow correlations to them.
Practical signs of flow pattern in a well
Operators can often infer the flow pattern from surface behavior. Steady wellhead pressure and smooth production suggest bubble or annular flow. Regular pressure fluctuations of a few percent with a period of seconds to a minute suggest slug flow. Large, slow cycles in wellhead pressure and gas rate, with liquid arriving in heads, suggest a well approaching liquid loading or a severe slugging problem in the flowline. Downhole gauges and distributed temperature sensing, now common in horizontal wells, can show where gas enters and how the flow pattern changes along the well.
Worked problem
Bubble or slug at the wellhead?
Near the wellhead of the 3-22H well, the superficial liquid velocity is 1.64 ft/s and the superficial gas velocity 1.64 ft/s. The liquid density is 51.2 lb/ft³, the gas density 1.56 lb/ft³ and the surface tension 25 dyn/cm. Use the Taitel-Barnea-Dukler bubble-to-slug criterion v_SL > 3.0 v_SG − 1.15 U, where U = [gσ(ρ_L − ρ_G)/ρ_L²]^0.25, to decide whether the flow is bubble or slug.
Show solution
- U = [9.81 × 0.025 × 795 / 820²]^0.25 = 0.130 m/s; 1.15 U = 0.150 m/s (0.49 ft/s).
- 3.0 v_SG − 1.15 U = 1.50 − 0.15 = 1.35 m/s (4.43 ft/s).
- v_SL = 0.5 m/s (1.64 ft/s) is less than 1.35 m/s, so the bubble-flow condition is not met.
Answer: Slug or churn flow near the wellhead, not bubble flow.
Bubble rise and drift-flux
A useful way to describe vertical flow, especially in the bubble and slug patterns, is the drift-flux model introduced by Zuber and Findlay in 1965. It writes the average gas velocity as the mixture velocity multiplied by a distribution parameter, plus a drift velocity that represents the buoyant rise of the gas:
The distribution parameter C₀ accounts for the gas being concentrated near the pipe center, where the liquid moves fastest; it is about 1.2 in turbulent slug flow and close to 1.0 in well-mixed bubble flow. The drift velocity v_d is about 1.53[gσ(ρ_L − ρ_G)/ρ_L²]^0.25 for small bubbles and 0.35√(gD) for Taylor bubbles. Rearranging gives the void fraction directly from the superficial velocities, and the liquid holdup is one minus the void fraction. The model is simple enough to run by hand, yet it captures the main reason holdup exceeds the no-slip fraction in vertical flow: gas rises through the liquid.
Drift-flux relations are widely used in wellbore simulators and in transient flow codes because they are continuous across bubble and slug flow and easy to tune. Many mechanistic models, described in lesson 8, use a drift-flux form for the bubble and slug patterns and switch to a separate film model for annular flow.
Checking a well model against a gauge
Ethan rebuilds the 3-22H tubing model with a mechanistic method that changes pattern with depth. The predicted flowing bottomhole pressure rises by about 60 psi and now falls within 2 percent of the gauge reading. Marisol is pleased but cautious. 'One gauge on one day is a single point,' she says. 'Check it again after the next rate test, and before we trust it for the artificial lift design.' Matching a model to several tests at different rates is the only reliable way to know that the pattern transitions, and not some compensating error, are right.
Common mistakes
MistakeAssuming one flow pattern for the whole well.
InsteadThe pattern changes as gas comes out of solution and expands up the tubing.
MistakeUsing vertical correlations in the build section of a horizontal well.
InsteadInclined flow can have higher holdup; use methods tested for deviated wells.
MistakeForgetting that bubble rise velocity causes slip in bubble flow.
InsteadEven bubble flow has holdup above the no-slip fraction at low liquid velocity.
MistakeIgnoring surface tension in the annular transition.
InsteadThe critical gas velocity depends on surface tension and the density difference.
Summary and key terms
- Upward vertical patterns are bubble, slug, churn and annular flow, in order of increasing gas velocity.
- In a producing well the pattern changes with depth as gas comes out of solution and expands.
- Duns and Ros used dimensionless liquid and gas velocity numbers to map vertical patterns.
- Taitel-Barnea-Dukler predict bubble-to-slug at a void fraction near 0.25 and annular flow above a critical gas velocity.
- Deviated sections can have higher holdup than vertical or horizontal pipe.
- Surface pressure behavior gives clues to the flow pattern in a well.
- Bubble flow
- Small gas bubbles dispersed in continuous liquid.
- Taylor bubble
- A large bullet-shaped bubble that nearly fills the pipe in slug flow.
- Churn flow
- A chaotic, frothy pattern between slug and annular flow.
- Drift velocity
- The rise velocity of gas relative to the mixture.
- Velocity number
- A dimensionless velocity scaled by liquid density and surface tension.
- Critical gas velocity
- The superficial gas velocity above which liquid is carried upward as a film and droplets.
Practice problems
Work each problem on paper first, then reveal the answer to check.
List the vertical upward patterns in order of increasing gas velocity.
Show answer
Bubble, slug, churn, annular.
Why does the pattern change up a flowing oil well?
Show answer
Pressure falls, gas comes out of solution and expands, so the gas velocity rises.
At about what void fraction does bubble flow change to slug flow?
Show answer
About 0.25.
Why are vertical correlations poor in build sections?
Show answer
Inclined flow has different holdup behavior, with liquid running back on the low side.
Lesson quiz · 5 questions
Score 60% or more to complete this lesson.
Create a free account to save your progress, take quizzes and earn a certificate.