
NUC-499 · Lesson 11 of 12 · 24 min
Final report
With the design review closed, the team has three weeks of drafted chapters and one week for final edits. Professor Mwangi reminds them how the report will be read. “Grant will read the executive summary and the recommendations, and perhaps the cost chapter. The university's leadership will read only the executive summary. Rohan and Lise will read the safety chapters closely and check the numbers. I will read all of it. Write it so that each of those readers gets what they need, and so that every number is the same wherever it appears.”
This lesson covers the purpose and audiences of a capstone design report, its structure, the executive summary, principles of technical writing, figures and tables, consistency and traceability of numbers, assumptions, limitations and open items, recommendations, and the editing and review process. It uses the Kestrel-10 report as the example, including the way the team presents an unfavorable economic result.
Purpose and audiences
A design report is a record of decisions and the evidence for them. It must allow a reader to understand what was designed, why each major choice was made, whether the design meets its requirements, what remains uncertain and what should happen next. It will be read by people with different needs and different amounts of time. The client and decision makers need the conclusion and its basis, quickly. Technical reviewers need enough detail to check the analysis. Future engineers who take the project forward need the assumptions, methods and open items, so that they do not repeat work or inherit hidden errors. And the course assessors need evidence of the team's engineering judgment.
Writing for several audiences is easiest with a layered structure. The executive summary gives the whole story in two pages. The body chapters give the design and its analysis in enough depth for a technical reader. The appendices hold the calculation packages, data and supporting material that a checker needs but a decision maker does not. Each layer must be consistent with the others, and the body must not contain anything important that the summary omits.
Structure of the report
The team's report has ten parts. The executive summary is followed by an introduction stating the problem, the stakeholders and the scope. The requirements chapter presents the requirements and how they were derived, including the heat demand analysis. The concept selection chapter presents the precedents, the concepts considered, the screening and the decision matrix. Four design chapters cover neutronics, thermal hydraulics, safety analysis and shielding. The licensing chapter sets out the route and the compliance matrix, and the cost and schedule chapter presents the estimate, the cost of heat and its sensitivities. The final chapter gives conclusions and recommendations. Appendices hold the calculation packages, the design review findings and their dispositions, the requirements traceability matrix and the references.
Each design chapter follows the same internal pattern, which helps readers find things: the requirements the chapter addresses, the design basis and inputs with their sources, the method, the results, a comparison with the requirements and acceptance criteria, the uncertainties and limitations, and the open items. That pattern is also a check for the writer. A chapter that cannot state which requirements it addresses probably contains analysis nobody needed; a chapter without an uncertainties section probably overstates its results.
The executive summary
The executive summary is the most important part of the report and the hardest to write. It must stand alone, because many readers will read nothing else. It must state the bottom line first: what was asked, what the team found, and what it recommends. It must give the key numbers, with their uncertainty where it matters, and the main reasons for each conclusion. And it must be honest about what is not known. A summary that reads like an advertisement for the design damages the credibility of everything behind it.
Hana drafts the summary last, after the chapters are stable, and the team rewrites it four times. The final version opens with Grant's question and answers it in two sentences: a 10 MWt pool-type reactor on campus could safely supply about nine-tenths of the university's heat, with passive cooling that needs no power or operator action for weeks, but its heat would cost several times as much as heat from gas, even with a substantial carbon cost. It would be justifiable only if the university valued its research, isotope and training mission at roughly the cost gap, about ten million dollars a year. The summary then gives the design in one paragraph, the safety case in one, licensing and schedule in one, cost in one, and the recommendations.
The team debates how prominently to present the cost result. Kofi worries that leading with it will make the whole project look like a failure. Professor Mwangi disagrees: the client asked a question, and an accurate answer that saves the university from a poor investment is a successful engineering outcome. Grant, when he sees the draft, agrees, and adds that a clear negative result with the conditions under which it would change is more useful to him than a vague positive one.
Technical writing that can be checked
Technical writing aims at clarity, not elegance. Each paragraph should make one point, stated in its first sentence. Sentences should be short enough to follow on a first reading and should say who did what: “the team assumed three years at full power” is clearer and more honest than “three years at full power was assumed”. Every number should have its units and, where it matters, its basis: “a fuel damage frequency of about 6 × 10⁻¹¹ per year from pool leaks, from a simplified event tree with illustrative data” tells the reader how much weight to give it, while the bare number does not.
Precision should match accuracy. A Class 5 cost estimate of 150.8 million dollars implies an accuracy it does not have; “about 150 million dollars, with an expected range of roughly 100 to 250 million” is honest. The same applies to physics: a one-group estimate of excess reactivity should be reported to the nearest few hundred pcm, not the nearest pcm, even though the code prints more digits. Hana adds a rounding rule to the team's style guide: report results to two or three significant figures unless there is a reason for more, and give the uncertainty or range where the reader needs it.
Terms must be defined at first use and used consistently. The team builds a glossary and a list of abbreviations, and checks that “capacity factor”, “availability” and “utilization”, which mean different things, are never used interchangeably. It also avoids language that sounds more certain than the analysis: words such as “proves”, “guarantees” or “eliminates” are replaced by “shows”, “provides” or “reduces”, unless the claim really is absolute, as it is for the absence of a pressure-driven rod ejection in an atmospheric pool.
Figures and tables
Figures and tables carry much of the information in a design report, and many readers look at them before the text. Each should be numbered, cited in the text before it appears, and given a caption that states its message rather than merely naming its content. “Levelized cost of heat against capacity factor” names the content; “Kestrel-10 heat costs several times gas heat at any plausible capacity factor” states the message. Axes need labels and units, and a figure should be readable when printed in black and white, which means distinguishing lines by style and labels as well as color.
One source of truth for numbers
The most common error in a multi-author report is inconsistency: the reactor power is 10 MWt in one chapter and 10.5 in another, the pool depth 11 m in the text and 10 m in a figure. In a design report, inconsistencies are more than embarrassing; they make a reviewer wonder which value was used in which calculation. The team prevents them with a design data sheet, a single table of every key parameter with its value, units, source and the calculation package that produced it. Every chapter takes its values from the data sheet, and when a value changes, as the peaking factor did after DR-01, the data sheet is updated first and the change is propagated to every chapter that uses it.
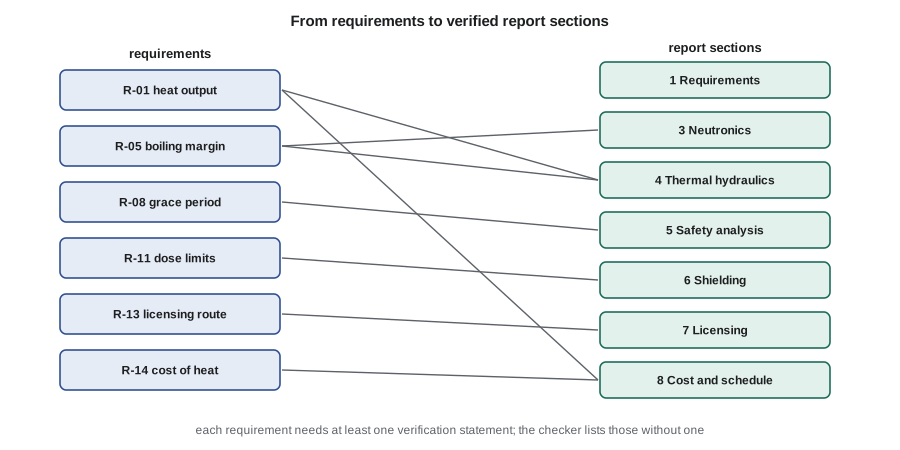
The team also writes a small script to check the report mechanically before each review: that section lengths are within their budgets, that figures and tables are cited in sequence with none missing, and that every requirement has a verification statement in a design chapter. Automated checks cannot judge content, but they catch the mechanical errors that otherwise consume a reviewer's attention.
# Final report checker: section word budgets, figure and table references, and requirement traceability.
import re
report = {   # section: (words written, words budgeted, text sample with references)
    "Executive summary": (980, 900, "Figure 1 shows the plant. Requirements R-01 to R-04 are met."),
    "1 Requirements and constraints": (2400, 2500, "Table 1 lists R-01 to R-16. Figure 2 is the load duration curve."),
    "2 Concept selection": (2100, 2000, "Table 2 is the decision matrix. Figure 3 compares the concepts."),
    "3 Neutronics": (3300, 3000, "Table 3 gives the reactivity balance. Figure 4 shows the core map; Figure 5 k versus radius."),
    "4 Thermal hydraulics": (3100, 3000, "Figure 6 shows the pool; Figure 7 the hot-channel temperatures. R-05, R-06 verified."),
    "5 Safety analysis": (3800, 3500, "Figure 8 is decay heat; Figure 9 the event tree. R-08, R-09, R-10 verified."),
    "6 Shielding": (2000, 2000, "Figure 10 shows dose zones. R-11 verified."),
    "7 Licensing strategy": (2200, 2200, "Figure 11 is the licensing roadmap. R-13 addressed."),
    "8 Cost and schedule": (2600, 2500, "Table 4 is the estimate; Figure 12 LCOH. R-14, R-15 compared."),
    "9 Conclusions and recommendations": (1100, 1200, "Table 5 summarizes compliance; see Figure 13."),
}
total_w = sum(w for w, b, t in report.values()); total_b = sum(b for w, b, t in report.values())
print(f"total {total_w:,} words against a budget of {total_b:,} ({total_w / total_b - 1:+.0%})")
for s, (w, b, t) in report.items():
    flag = "  over by more than 5 %" if w > 1.05 * b else ""
    print(f"  {s:36s}{w:6,d} / {b:6,d}{flag}")
text = " ".join(t for w, b, t in report.values())
figs = sorted({int(n) for n in re.findall(r"Figure (\d+)", text)})
tabs = sorted({int(n) for n in re.findall(r"Table (\d+)", text)})
missing_f = [n for n in range(1, max(figs) + 1) if n not in figs]
print("figures cited:", figs, "missing from sequence:", missing_f or "none")
print("tables cited:", tabs)
late = " ".join(t for s, (w, b, t) in report.items() if s[0] in "456789")
verified = {int(x) for x in re.findall(r"R-(\d+)", late)}
print("requirements with no verification statement in sections 4 to 9:", [f"R-{n:02d}" for n in range(1, 17) if n not in verified])total 23,580 words against a budget of 22,800 (+3%) Executive summary 980 / 900 over by more than 5 % 1 Requirements and constraints 2,400 / 2,500 2 Concept selection 2,100 / 2,000 3 Neutronics 3,300 / 3,000 over by more than 5 % 4 Thermal hydraulics 3,100 / 3,000 5 Safety analysis 3,800 / 3,500 over by more than 5 % 6 Shielding 2,000 / 2,000 7 Licensing strategy 2,200 / 2,200 8 Cost and schedule 2,600 / 2,500 9 Conclusions and recommendations 1,100 / 1,200 figures cited: [1, 2, 3, 4, 5, 6, 7, 8, 9, 10, 11, 12, 13] missing from sequence: none tables cited: [1, 2, 3, 4, 5] requirements with no verification statement in sections 4 to 9: ['R-01', 'R-02', 'R-03', 'R-04', 'R-07', 'R-12', 'R-16']
The first run of the checker finds three sections more than 5 percent over budget, which the team trims, and seven requirements with no verification statement in sections 4 to 9. Four of those, R-01 to R-04, are verified in the executive summary and the requirements chapter but not restated in the design chapters; the team adds short verification statements to the thermal hydraulics and cost chapters. R-07 and R-12 are verified in the neutronics and shielding chapters but under different wording that the checker does not recognize, which the team corrects. R-16, the research and teaching requirement, turns out to have no verification at all, because nobody owned it; Kofi adds a section describing the irradiation positions at the core periphery and their expected flux.
Assumptions, limitations and open items
Every design at the concept stage rests on assumptions, and a good report states them where a reader will find them. The team includes a consolidated list of key assumptions, each with its basis and the chapter that depends on it, and a limitations section for each analysis that says what the method cannot show. The open items list collects every unresolved issue, including the design review findings that were deferred, with what must be done to resolve each. For Kestrel-10 the list includes the full-core physics calculation, the detailed hot channel analysis with a pin-power distribution, the seismic analysis of the chimney and core support, the warm surface layer design, the security design, the capture-gamma calculation for the side wall, and a cost estimate with a vendor.
Recommendations
Recommendations should follow from the conclusions, be specific enough to act on, and say who should act. The team makes four. First, the university should not proceed with Kestrel-10 as a heat supply justified on cost alone. Second, if the university and its partners value a research, isotope and training reactor at roughly the cost gap, it should commission a feasibility study with a reactor vendor, including a Class 3 estimate, a security assessment and pre-licensing engagement with the NRC, before any decision to build. Third, the university should pursue lower-cost options for cutting its heating emissions in parallel, such as heat pumps and building retrofits, which the team did not evaluate in detail. Fourth, the university should explore with the city whether a larger district heating reactor serving both the campus and the city network would change the economics, since the sensitivity analysis showed scale to be the strongest lever.
Editing and review
The report goes through three review cycles. In the first, each chapter is reviewed by a team member other than its author for content and clarity. In the second, Hana reads the whole report for consistency, structure and the flow from requirements to conclusions, and the checker is run. In the third, Professor Mwangi and Rohan review a near-final draft and return comments, which are tracked and dispositioned like design review findings. The final step is a read-aloud of the executive summary by the whole team, which catches more awkward sentences in an hour than any other method.
The report also records who did what. Each chapter names its author and reviewer, and each calculation package carries the names of its preparer and checker. Professional engineering practice places responsibility on the individuals who prepare and check work, and a student team that records authorship is practicing the habit it will need when its members sign engineering documents as licensed engineers.
Worked problem
Rounding for honest precision
The cost code prints an overnight cost of 150.8 million dollars and a levelized cost of heat of 274 dollars per MWh at the base case. The estimate is Class 5, with a typical range of about −30 to +60 percent for this project. How should these be reported in the executive summary?
Show solution
- Low end of the overnight cost range = 150.8 × 0.7 ≈ 105 million; high end = 150.8 × 1.6 ≈ 240 million.
- Report as “about 150 million dollars, with an expected range of roughly 100 to 250 million”.
- The cost of heat scales roughly with capital for this plant, so report “about 270 dollars per MWh at the base case, and roughly 200 to 400 across the cost range and discount rates considered”.
Answer: Two significant figures and a stated range convey the result honestly; the extra digits printed by the code suggest an accuracy the estimate does not have.
Common mistakes
MistakeThe executive summary should build suspense and reveal the conclusion at the end.
InsteadState the bottom line first; many readers will read nothing else.
MistakeMore decimal places make results look more rigorous.
InsteadPrecision should match accuracy; extra digits mislead.
MistakeCaptions should describe what a figure shows.
InsteadCaptions should state the message the figure supports.
MistakeAn unfavorable result should be softened to protect the project.
InsteadAn honest result with the conditions under which it would change is the most useful outcome.
Summary and key terms
- A design report records decisions and evidence for readers with different needs, using a layered structure.
- Each design chapter states its requirements, inputs, method, results, comparison with criteria, uncertainties and open items.
- The executive summary stands alone and states the bottom line first, honestly.
- Clear technical writing uses short paragraphs, active voice, units and bases for numbers, and precision matched to accuracy.
- A design data sheet is the single source of truth for numbers; a checker catches mechanical errors.
- Assumptions, limitations and open items are stated explicitly, and recommendations are specific and say who should act.
- Executive summary
- A short, self-contained statement of the problem, findings and recommendations.
- Design data sheet
- A single table of key parameters with values, units and sources, used by every chapter.
- Open items list
- A list of unresolved issues with the work needed to resolve each.
- Limitation
- A statement of what an analysis method cannot show.
- Significant figures
- The digits in a number that carry meaningful information about its precision.
- Recommendation
- A specific proposed action that follows from the conclusions.
Practice problems
Work each problem on paper first, then reveal the answer to check.
Why should the executive summary be written last?
Show answer
It must reflect the final, stable content of the chapters.
What is wrong with the caption “Levelized cost of heat against capacity factor”?
Show answer
It names the content but not the message the figure supports.
How does the team keep numbers consistent across chapters?
Show answer
With a design data sheet that every chapter uses, updated first when a value changes.
Why did R-16 have no verification statement?
Show answer
Nobody owned it, so it was never addressed in a design chapter.
What were the team's four recommendations?
Show answer
Do not proceed on cost alone; commission a vendor feasibility study if the mission is valued; pursue lower-cost options in parallel; explore a larger city-scale reactor.
Lesson quiz · 5 questions
Score 60% or more to complete this lesson.
Create a free account to save your progress, take quizzes and earn a certificate.