
NUC-410 · Lesson 5 of 12 · 21 min
Event trees
With the auxiliary feedwater fault tree finished, Lise gives Hana the next step. "A fault tree tells you how likely one system is to fail. An event tree tells you what happens to the plant when an initiating event occurs and the systems succeed or fail in different combinations," she says. "Together they are the core of a Level 1 probabilistic risk assessment. Start with a small-break loss-of-coolant accident, because the sequences are easy to follow and the lessons carry over to everything else."
From an initiating event to outcomes
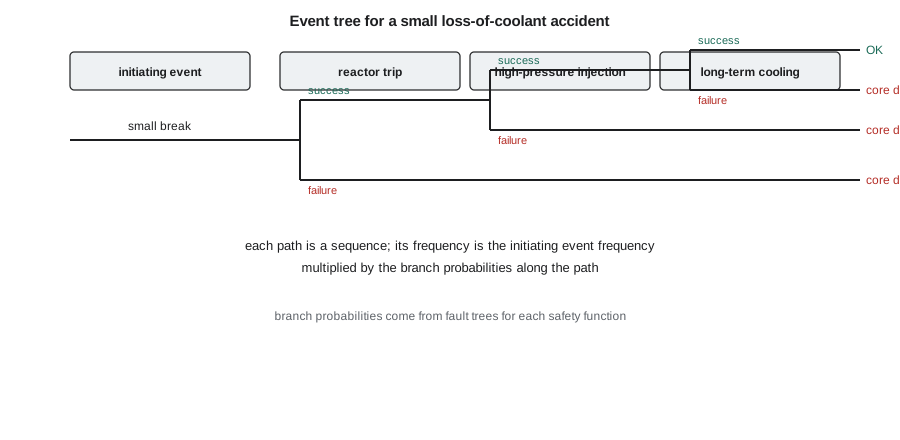
An event tree is an inductive model. It starts with an initiating event and works forward in time through the safety functions or systems that are needed to bring the plant to a safe, stable state. At each step, called a heading or top event, the tree branches into success and failure. Each path through the tree, from the initiating event to an end state, is an accident sequence. The end state of each sequence is classified, for example as successful mitigation, core damage, or a particular plant damage state that will be analyzed further in a Level 2 assessment.
Event trees complement fault trees. A fault tree is deductive: it starts from a failure and asks what caused it. An event tree is inductive: it starts from a cause and asks what follows. In a typical probabilistic assessment, each heading of an event tree is a safety function whose failure probability is calculated by a fault tree. The combination of event trees and fault trees, linked so that shared components and support systems are handled correctly, is called the linked fault tree approach and is used by most modern assessments.
Building an event tree
The first step is to understand what the plant needs after the initiating event. For a small break in a light water reactor, the reactor must be shut down, coolant must be injected at high pressure to make up for the leak, heat must be removed through the steam generators or by depressurizing the primary system, and eventually water collected in the containment sump must be recirculated for long-term cooling. These needs are written as success criteria: for example, one of two high-pressure injection pumps delivering to at least two cold legs within ten minutes. The success criteria come from deterministic thermal-hydraulic analysis, often best-estimate rather than conservative.
The headings are arranged in the order in which the functions are needed. Branches that are logically impossible or irrelevant are pruned: if the reactor fails to trip, the sequence may be transferred to a separate anticipated transient without scram event tree, and if injection fails there is no need to ask about recirculation. Dependencies between headings are handled either by conditioning the branch probabilities on what has happened earlier, or by linking the fault trees so that a component that fails in one heading is also failed in later headings that need it.
In a PWR, the small-break loss-of-coolant event tree has headings for reactor trip, high-pressure injection, auxiliary feedwater to the steam generators, primary depressurization if injection is not enough, low-pressure injection, and recirculation from the containment sump. Feed-and-bleed cooling, in which operators open the pressurizer relief valves and use injection to remove heat if all feedwater is lost, appears as a branch in the loss-of-feedwater event tree.
Sequence frequencies
The frequency of each sequence is the initiating event frequency multiplied by the probabilities of the branches along its path. For a success branch the probability is one minus the failure probability, which is usually very close to one. The core damage frequency contributed by this initiating event is the sum of the frequencies of all sequences that end in core damage. Repeating this for every initiating event and summing gives the total core damage frequency for internal events at power.
# Event tree sequence frequencies for a small loss-of-coolant accident (illustrative).
ie = 5e-4                     # small LOCA frequency per reactor-year
p_trip, p_hpi, p_ltc = 1e-5, 2e-3, 1e-3   # failure probabilities of each function
seqs = {
    "trip OK, injection OK, long-term cooling OK": ie * (1-p_trip) * (1-p_hpi) * (1-p_ltc),
    "trip OK, injection OK, long-term cooling fails": ie * (1-p_trip) * (1-p_hpi) * p_ltc,
    "trip OK, injection fails": ie * (1-p_trip) * p_hpi,
    "trip fails (ATWS)": ie * p_trip,
}
cdf = 0.0
for name, f in seqs.items():
    damage = "OK" if name.endswith("cooling OK") else "core damage"
    if damage != "OK": cdf += f
    print(f"{name:48s} {f:9.2e}  {damage}")
print(f"core damage frequency from small LOCA: {cdf:.2e} per reactor-year")trip OK, injection OK, long-term cooling OK 4.98e-04 OK trip OK, injection OK, long-term cooling fails 4.99e-07 core damage trip OK, injection fails 1.00e-06 core damage trip fails (ATWS) 5.00e-09 core damage core damage frequency from small LOCA: 1.50e-06 per reactor-year
The program shows that, with these illustrative numbers, failure of high-pressure injection is the largest contributor, followed by failure of long-term cooling. The failure-to-trip sequence is very small because reactor trip is highly reliable. The total contribution of small breaks to core damage frequency is about 1.5 × 10⁻⁶ per reactor-year. In a real assessment each of these branch probabilities would come from a fault tree that includes support systems, common-cause failures and human actions.
Plant damage states and the bridge to Level 2
An event tree for a Level 1 assessment ends at core damage or success, but not all core damage sequences are alike. A sequence in which the containment sprays and coolers work leads to a very different containment response from one in which all electrical power is lost. Analysts therefore group the core damage sequences into plant damage states, defined by attributes such as the pressure in the reactor coolant system at the time of core damage, whether emergency cooling was available, whether containment heat removal works and whether containment was isolated or bypassed. Each plant damage state is the starting point for a containment event tree in the Level 2 assessment described in lesson 6.
| Attribute | Example values | Why it matters |
|---|---|---|
| Coolant system pressure at core damage | high or low | high-pressure melt ejection can load containment |
| Containment status | intact, isolation failure, bypass | bypass leads directly to release |
| Containment heat removal | sprays and coolers available or not | controls long-term pressure |
| Water in the reactor cavity | flooded or dry | affects core-concrete interaction |
| Timing | early or late core damage | affects evacuation and decay heat |
Dependencies and success criteria
Event tree results are sensitive to how dependencies are treated. If the same electrical bus powers high-pressure injection and low-pressure injection, the failure of the bus fails both headings, and the two branch probabilities cannot be multiplied as if independent. Linked fault trees handle this automatically by solving the whole sequence logic at once. Operator actions are another source of dependency: if an operator fails to diagnose the event correctly, later actions in the same sequence are also likely to fail. Human reliability analysts assign conditional probabilities that account for this dependence, as lesson 7 explains.
Success criteria have a similar effect. A conservative success criterion, such as requiring two pumps where best-estimate analysis shows one is enough, raises the failure probability of the heading and hence the core damage frequency. Probabilistic assessment aims to be realistic, so success criteria are based on best-estimate analysis with margin. This is one of the main differences between deterministic and probabilistic thinking, and a source of confusion when results are compared.
Worked problem
A feed-and-bleed branch
A loss of main feedwater occurs with frequency 0.1 per year. Auxiliary feedwater fails with probability 1 × 10⁻⁴. Given that, operators must start feed-and-bleed cooling; they fail with probability 0.05, and the equipment fails with probability 0.01. What is the core damage frequency from this sequence?
Show solution
- Feed-and-bleed fails if the operators or the equipment fail: 0.05 + 0.01 ≈ 0.06.
- Sequence frequency: 0.1 × 1 × 10⁻⁴ × 0.06 = 6 × 10⁻⁷ per year.
- The operator action contributes most of the branch failure probability.
Answer: About 6 × 10⁻⁷ per reactor-year, dominated by the human action.
Event trees for other initiating events
Each initiating event group has its own event tree. A transient event tree, for example for a turbine trip, has headings for reactor trip, secondary heat removal and pressure relief. A loss of off-site power event tree adds the emergency diesel generators and, if they fail, the time available before batteries deplete and the probability of recovering off-site power within that time. A steam generator tube rupture event tree includes the operators' actions to identify and isolate the faulted steam generator and to cool down the plant before the secondary side relief valves lift. Each tree reflects the plant's specific design and procedures.
For multi-unit sites like TVA's Browns Ferry or Sequoyah, some initiating events, such as a loss of off-site power or a severe storm, affect all units at once and may challenge shared equipment and staff. Multi-unit probabilistic assessment, which received more attention after Fukushima, models these site-wide events explicitly.
Reading an event tree critically
An event tree is a model, and its results depend on choices. A reviewer asks whether the list of headings covers every function the plant needs, whether the success criteria are justified by analysis, whether the order of headings matches the real timing, whether dependencies are captured, whether operator actions have realistic times and probabilities, and whether the end states are correctly classified. The most important outputs are not the total frequency but the dominant sequences: the few paths that contribute most of the risk. Those sequences tell designers and operators where improvements are worth most.
Event trees are also valuable for communication. A well-drawn event tree shows plant staff and regulators, at a glance, what the plant relies on after a given event. It is a natural basis for emergency operating procedures, which are organized around restoring and maintaining the same safety functions. When procedure writers and probabilistic analysts work from the same event trees, both products improve.
Success criteria and timing
Every heading in an event tree depends on success criteria: how many trains of which system must work, for how long, and by when. These criteria come from thermal-hydraulic analysis, usually best-estimate rather than conservative, because the aim of a probabilistic assessment is a realistic picture of risk. For a small break, the criterion might be one of two high-pressure injection pumps within a stated time, or depressurization followed by low-pressure injection. Different break sizes can need different criteria, which is why small, medium and large breaks are usually separate initiating events with separate trees.
Timing also determines which recovery actions are possible. If an event tree shows that core damage would occur six hours after a loss of all AC power, the analyst can credit the recovery of offsite power or the use of portable equipment within that time, with probabilities that depend on the time available. Time-dependent recovery curves for offsite power, based on industry data, are a common input. Event trees that ignore timing either understate risk, by crediting impossible recoveries, or overstate it, by ignoring recoveries that are likely.
From event trees to insights
Event trees are often the most useful part of a probabilistic assessment for communicating with operators and designers, because they read like a story of how an accident could unfold. Reviewing the dominant sequences with the operating crews checks whether the modeled actions are realistic and sometimes reveals procedure gaps. Designers use them to test whether a proposed change, such as adding a diverse pump or a passive heat sink, removes or weakens important sequences. A good event tree analysis therefore ends not with a number but with a list of insights that the plant can act on.
Event trees also make the role of each safety function visible. A heading that appears in many important sequences, such as the availability of emergency power, points to a support system whose reliability affects many parts of the response. When designers see that a single heading dominates, they can add diversity, for example a different type of pump or a passive system that needs no power, so that one failure no longer opens so many paths to core damage.
Common mistakes
MistakeAn event tree and a fault tree are the same thing drawn differently.
InsteadAn event tree works forward from a cause through safety functions; a fault tree works backward from a failure to its causes.
MistakeBranch probabilities along a path can always be multiplied.
InsteadOnly if they are independent; shared support systems and operator dependencies must be handled explicitly.
MistakeThe total core damage frequency is the most useful result.
InsteadThe dominant sequences and their contributors are usually more useful for decisions.
Summary and key terms
- An event tree starts from an initiating event and branches on the success or failure of each safety function.
- Sequence frequency is the initiating event frequency times the branch probabilities.
- Branch probabilities usually come from fault trees, linked to handle dependencies.
- Core damage sequences are grouped into plant damage states for Level 2.
- Success criteria come from best-estimate analysis; conservative criteria bias results.
- Event tree
- An inductive model of accident sequences following an initiating event.
- Heading
- A safety function or system question at a branch point of an event tree.
- Accident sequence
- One path through an event tree from initiating event to end state.
- Success criterion
- The minimum equipment and timing needed for a safety function to succeed.
- Plant damage state
- A group of core damage sequences with similar containment challenges.
- Feed-and-bleed
- Cooling the core by injecting water and venting steam through relief valves.
Practice problems
Work each problem on paper first, then reveal the answer to check.
What is the difference between inductive and deductive logic in risk analysis?
Show answer
Event trees reason forward from causes; fault trees reason backward from failures.
An initiating event of 1 × 10⁻² per year leads to core damage if two independent functions fail, each with 1 × 10⁻³. What is the frequency?
Show answer
1 × 10⁻⁸ per year.
Why group sequences into plant damage states?
Show answer
So that containment response can be analyzed for each group in Level 2.
Name a CANDU feature that can remove heat if emergency coolant injection fails.
Show answer
The heavy water moderator surrounding the pressure tubes.
What makes a sequence dominant?
Show answer
It contributes a large share of the total core damage frequency.
Lesson quiz · 5 questions
Score 60% or more to complete this lesson.
Create a free account to save your progress, take quizzes and earn a certificate.