
MSBA-304 · Lesson 10 of 12 · 20 min
Measuring productivity
▶ Video coming soon A video version of this lesson is on the way.
The last week began on Monday, August 16, with the question Tidewater's owners would ask in October: is Copilot making the team more productive? The first course had covered the usage metrics dashboard and the cost side. This session was about measurement itself. Rosa joined, because she would present the numbers. "I can show them adoption," she said. "Seats used, suggestions accepted. What I cannot show them yet is whether any of it matters." This lesson covers what productivity means for developers, what Copilot's usage metrics measure and what they do not, combining activity data with outcomes and surveys, setting baselines and comparisons, the danger of measuring individuals, and turning numbers into an honest report.
What productivity means
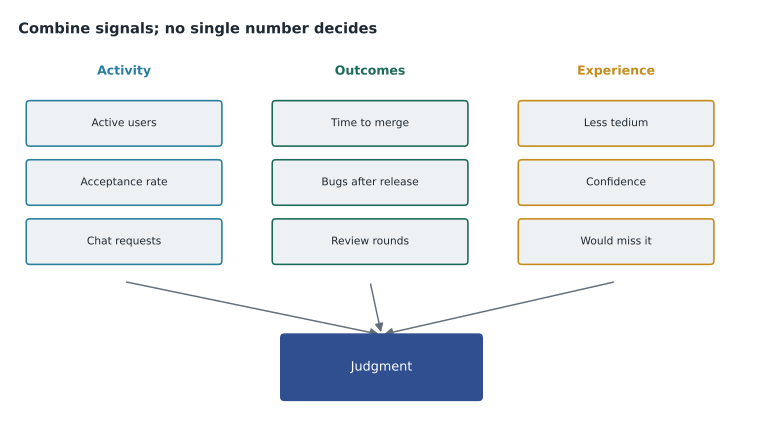
Developer productivity is not one number. Lines of code, the oldest measure, is easy to count and almost meaningless: a good refactor often removes lines. Research frameworks describe productivity across several dimensions at once. The SPACE framework, for example, groups measures into satisfaction and well-being, performance, activity, communication and collaboration, and efficiency and flow, and warns that any single dimension on its own misleads. Delivery measures such as how often a team ships, how long changes take to reach users, and how often changes cause problems describe outcomes rather than effort.
| Dimension | Example measure | Source at Tidewater |
|---|---|---|
| Satisfaction | Do developers find their work less tedious? | Short monthly survey |
| Performance | Bugs found after release; review comments applied | Issue tracker, review records |
| Activity | Suggestions accepted, chat requests, agent tasks | Copilot usage metrics |
| Collaboration | Review turnaround, time newcomers take to first merge | Pull request data |
| Efficiency and flow | Time from first commit to merge; interruptions | Pull request data, survey |
The point is balance. Copilot usage metrics are mostly activity measures. They show that people use the tool. Whether that use improves outcomes needs measures from the other dimensions.
What Copilot usage metrics show
GitHub's Copilot usage metrics cover adoption, engagement, acceptance and some delivery signals. They include daily, weekly and monthly active users; chat requests per active user and by chat mode; agent adoption; inline suggestion acceptance; lines suggested, added and deleted in the editor; and pull request measures such as pull requests created and merged, median time to merge and pull requests created by Copilot. Users are also grouped into adoption cohorts, from passive users to those working mainly through agents. The dashboard shows 28-day trends, and data is typically available within about two full UTC days.
Some activity is not included. Chat on GitHub.com and GitHub Mobile is excluded from the usage metrics, and seat and license data come from a separate user management interface. Most measures depend on telemetry from editors, so users seen only through server-side data have gaps in some breakdowns. Access is controlled: enterprise owners see enterprise metrics, and an organization can grant a custom role with permission to view organization Copilot metrics, which is how Dmitri had been given access in the first course.
| Metric | What it tells you | What it does not |
|---|---|---|
| Active users | How many people use Copilot | Whether their work improved |
| Acceptance rate | How often shown suggestions are kept at the moment | Whether accepted code survived review |
| Lines suggested and added | Volume of assisted code | Quality, or whether less code would have been better |
| Chat requests by mode | How people use chat and agents | Whether the answers were right |
| Median time to merge | Speed of delivery | Why it changed; other factors also matter |
| Pull requests created by Copilot | Agent contribution | How much review effort they needed |
Baselines and comparisons
A number means little without something to compare it with. Before the pilot, Rosa had recorded a baseline from the previous three months: median time to merge, bugs found after release, review rounds per pull request and a short survey. Comparing the pilot months with that baseline gives a before-and-after view. It is not proof, because other things change too, such as the season, the work mix and the team, but it is far better than looking at pilot numbers alone.
baseline = {"median_hours_to_merge": 26, "bugs_after_release_per_month": 3.0, "review_rounds": 2.6}
pilot = {"median_hours_to_merge": 19, "bugs_after_release_per_month": 3.0, "review_rounds": 2.1}
for key in baseline:
    before, after = baseline[key], pilot[key]
    change = (after - before) / before
    direction = "lower" if change < 0 else "higher" if change > 0 else "no change"
print(f"{key}: {before} -> {after} ({direction}, {abs(round(change * 100))} in 100)")median_hours_to_merge: 26 -> 19 (lower, 27 in 100) bugs_after_release_per_month: 3.0 -> 3.0 (no change, 0 in 100) review_rounds: 2.6 -> 2.1 (lower, 19 in 100)
What this code does
The example holds three measures for the months before the pilot and the same three during it. For each one it works out how much the value changed compared with where it started, says whether it went up, down or stayed the same, and prints the change per 100 of the starting value. The output shows time to merge down by about 27 in 100, review rounds down by about 19 in 100 and bugs after release unchanged, which is the pattern the team hoped for: faster delivery without more defects.
Rosa was careful with the result. The pilot ran through June and July, when TrailCheck usually gets fewer large changes, and the code review habits from the first course had started at the same time. Both could explain part of the faster merges. She reported the numbers with those caveats rather than claiming Copilot caused the whole change.
Worked problem
A fairer comparison
Four people had seats during the pilot, and their median time to merge went from 26 to 19 hours. Two others who regularly open pull requests, Malik and an editor who maintains the data checks, had no seats; their median went from 25 to 23 hours over the same months. What does the comparison suggest?
Show solution
- Change with seats: 26 to 19, a fall of 7 hours.
- Change without seats: 25 to 23, a fall of 2 hours.
- Something other than Copilot, such as the quieter season, explains about 2 hours of improvement for everyone.
- The difference between the groups, about 5 hours, is a better estimate of Copilot's effect, though the groups are small and not random.
Answer: About 5 hours of the 7-hour fall may be due to Copilot. A comparison group separates the tool's effect from changes that affected everyone.
Surveys and experience
Some benefits do not show in activity data. Developers may spend less time on tedious work, feel more confident in unfamiliar code or find it easier to get started on a task. Short, regular surveys capture this. Tidewater's monthly survey had five questions on a five-point scale, plus one open question, and took two minutes. Self-reported time savings tend to be optimistic, so Rosa treated them as a direction rather than an amount, and paired them with the outcome measures.
| Survey question | Pilot average (1 to 5) |
|---|---|
| Copilot reduced time spent on repetitive code | 4.3 |
| I understand unfamiliar code faster | 4.0 |
| I trust suggestions without checking them | 1.8 |
| Review of my pull requests is quicker | 3.5 |
| I would be unhappy to lose Copilot | 4.5 |
Do not rank individuals
Activity metrics invite comparison between people, and comparison invites gaming. A developer judged on accepted suggestions can accept more and delete later; one judged on lines added can write longer code. GitHub's documentation advises looking for patterns across signals rather than relying on a single number. Tidewater wrote a rule into its Copilot guidelines: usage metrics are reviewed at team level, never used in individual performance reviews, and shared with the whole team. The point of measurement is to decide how to use the tool better, not to grade people.
Measuring agents and code review
Agent work needs its own measures, because a single agent task can replace many completions or chat requests. The usage metrics count pull requests created by Copilot and show agent adoption, and the cohort view shows how many people work mainly through agents. Those numbers say how much agents are used. To judge whether that use is worthwhile, Tidewater tracked two extra things by hand for every agent pull request during the pilot: how many review rounds it needed before merge, and whether it was merged, merged after substantial rework, or closed. Of nine agent pull requests, five were merged after one round, three after rework and one was closed because the task had been framed badly. That small record was more useful to Priya than any dashboard figure, because it showed where agents saved time and where they created review work. Copilot code review was measured the same way, by the share of its comments that were applied, which was about 45 in 100.
Watching for over-reliance
Measurement is not only about benefits. The first course discussed over-reliance: accepting suggestions without understanding them, losing practice at skills the team still needs, and trusting the tool in areas where it is weak. Some signals can be watched. A rising acceptance rate alongside rising review rounds may mean people are accepting more without reading. Newer developers who rarely use chat to ask for explanations, but accept many completions, may be skipping the learning. The survey question about trusting suggestions without checking them, which scored low in the pilot, is a direct check. Rosa added one line to the quarterly report template: "signs of over-reliance this quarter, and what we are doing about them". Naming it every quarter kept it from being forgotten once the tool became routine.
Cost and value
Productivity measurement ends in a cost question. On Copilot Business each seat costs 19 US dollars a month and adds 1,900 AI credits to a pooled allowance; extra usage beyond the pool costs a cent a credit. Rosa compared that with a deliberately cautious estimate of time saved.
Worked problem
A cautious value estimate
Four seats cost 76 US dollars a month, plus about 11 dollars of extra credits. Developers report saving about 2 hours a week. Rosa counts only half of that, values an hour at 45 US dollars and assumes 4.3 weeks a month. Compare value with cost for the four seats.
Show solution
- Monthly cost: 76 + 11 = 87 US dollars.
- Hours counted per developer per month: 2 x 0.5 x 4.3 = 4.3 hours.
- Value: 4 developers x 4.3 x 45 = 774 US dollars.
- Ratio: 774 / 87 is about 8.9.
Answer: Even with half the reported savings, the value is roughly nine times the cost. The conclusion holds unless the time savings are almost entirely imaginary.
For the owners, Rosa noted that the monthly cost was predictable because the budget alert and the hard stop from the first course capped extra usage.
Turning numbers into a report
The October review would be a one-page report. Rosa drafted its structure in this session, with Copilot Chat helping to turn her notes into clear sentences. She checked every number in the draft against the source data, because a model summarizing numbers can round, swap or invent them.
| Section | Content |
|---|---|
| Goals | The goals and measures written before the pilot |
| Activity | Active users, acceptance and agent use, with caveats |
| Outcomes | Time to merge, bugs after release, review rounds, compared with baseline and with non-users |
| Experience | Survey results and two quotations |
| Cost | Seats, extra usage, budget alerts |
| Risks | Data incidents (none), over-reliance signals, open questions |
| Recommendation | What to change next quarter |
The recommendation section is where measurement turns into decisions. Rosa's draft for October proposed three: keep the four developer seats and add the September seats as planned; turn on the usage metrics export so the team could keep its own history beyond the dashboard's 28-day window; and repeat the comparison with the editors' trial seats, using their error rate on data checks as the outcome measure. Each recommendation named the measure that would show whether it worked. Priya's comment on the draft was the best summary of the session: "If we cannot say how we would know it worked, we are not ready to decide."
Common mistakes
MistakeUsing acceptance rate or lines added as a measure of productivity.
InsteadTreat them as activity signals and pair them with outcomes and experience.
MistakeReporting pilot numbers without a baseline.
InsteadMeasure before the change and compare.
MistakeCrediting the tool with every improvement.
InsteadUse a comparison group or caveats for other changes.
MistakeRanking individuals by usage metrics.
InsteadReview metrics at team level and never in performance reviews.
MistakeTrusting a model's summary of the numbers.
InsteadCheck every figure against the source data.
Summary and key terms
- Productivity has several dimensions; no single number captures it.
- Copilot usage metrics show adoption, engagement, acceptance, lines and some pull request measures over 28-day trends.
- Usage metrics exclude chat on GitHub.com and GitHub Mobile and are mostly activity signals.
- Baselines and comparison groups separate the tool's effect from other changes.
- Short surveys capture experience; self-reported time savings should be discounted.
- Measure at team level, never rank individuals, and compare cautious value estimates with cost.
- Baseline
- Measurements taken before a change, used for comparison.
- Comparison group
- People not affected by a change, whose results show what would have happened anyway.
- Acceptance rate
- The share of shown suggestions that are accepted; an activity signal.
- SPACE framework
- A research framework describing developer productivity across five dimensions.
- Adoption cohort
- A group of users classed by how they use Copilot, from passive to agent-first.
Practice problems
Work each problem on paper first, then reveal the answer to check.
Why is acceptance rate a poor measure of productivity on its own?
Show answer
It shows what looked useful at the moment, not whether the code was correct, kept or valuable.
What does a comparison group add to a before-and-after measure?
Show answer
It shows how much changed for reasons other than the tool, so the tool's effect can be estimated.
Which Copilot activity is excluded from usage metrics?
Show answer
Copilot Chat on GitHub.com and on GitHub Mobile.
Lesson quiz · 5 questions
Score 60% or more to complete this lesson.
Create a free account to save your progress, take quizzes and earn a certificate.