
LVT-210 · Lesson 11 of 12 · 21 min
OTDR testing (Tier 2)
A loss test set says how much light a link loses. It does not say where. An optical time-domain reflectometer, or OTDR, does: it sends short pulses of light into one end of a fiber and listens for what comes back, building a picture of the whole link from a single end. Each connector, splice, bend and break appears on the trace at its distance from the instrument, with its own loss and reflectance. An OTDR trace is the fiber equivalent of the time-domain diagnostics that LVT-130 used to find faults in copper, and it is the second tier of fiber certification.
This lesson explains how an OTDR works, how to read a trace, the launch and receive cables that make the ends of a link visible, why splices must be measured from both directions, and the settings that decide what an OTDR can and cannot see. It uses the Riverside campus link, which Hollis tests from room 1A and from the gymnasium before the capstone.
How an OTDR works
As light travels down a fiber, a tiny fraction of it is scattered in every direction by microscopic variations in the glass. This is Rayleigh scattering, the same effect that is the main cause of attenuation in fiber. A small part of the scattered light travels back toward the source. The OTDR fires a pulse, then measures the power of this backscatter as it returns, moment by moment. Light from further along the fiber returns later and weaker, because it has traveled further both ways, so the backscatter fades steadily with time. Plotted against distance, it forms a sloping line whose slope is the fiber's attenuation.
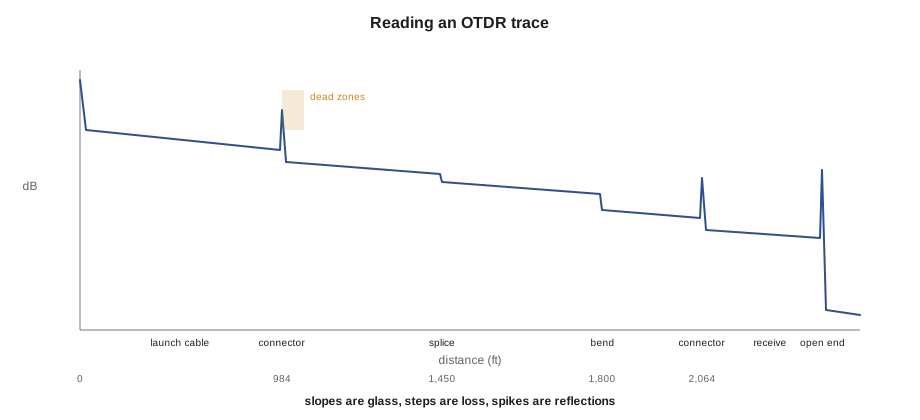
Wherever something interrupts the fiber, the trace shows it. A splice or a bend causes a step down in the backscatter, because less light continues past it: that step is the event's loss. A connector, a mechanical splice or a break also reflects light straight back, which appears as a spike above the backscatter line: the spike's height gives the reflectance. At the end of the fiber, the backscatter drops to the instrument's noise floor. The OTDR converts time to distance using the fiber's group index of refraction, which the operator sets from the cable data sheet.
Here d is the distance to the event, c is the speed of light in a vacuum, t is the round-trip time and n_g is the group index, about 1.468 for standard singlemode at 1310 nm. The factor of two is there because the light travels out and back. A wrong group index makes every distance wrong by the same proportion, the same effect a wrong NVP has on copper length in LVT-130. The OTDR measures fiber length, not cable length: because fibers are laid slightly longer than the cable in loose tubes and are twisted in stranded cables, the fiber is typically about one percent longer than the jacket marks show.
Launch and receive cables
An OTDR cannot see the first few meters after its own connector. The pulse reflecting off the instrument's own connector blinds the receiver briefly, and the backscatter takes time to recover. The same is true after any strong reflection. The length the OTDR cannot resolve after a reflective event is its dead zone. The event dead zone is the shortest distance after one reflective event at which a second can be detected as separate; the attenuation dead zone is the distance after which the loss of a second event can be measured. For a good field OTDR with a short pulse, these are typically about 3 ft and 13 ft, and longer with wider pulses.
To measure the first connector of the link, the OTDR is connected through a launch cable, a reel of fiber of the same type as the link, long enough that the instrument's dead zone ends well before the link starts. The launch cable's far connector mates with the link's first connector, and that connection appears on the trace with clean backscatter on both sides, so its loss can be measured. A receive cable at the far end does the same for the last connector. Without them, the two end connections, usually the two most important events in a short link, cannot be measured at all. Typical launch cables for building and campus work are 330 to 1,000 ft for multimode and 1,000 to 3,300 ft for singlemode.
# Is the launch cable long enough, and can the near splice be measured?
EDZ = 3         # event dead zone at this pulse width, ft
ADZ = 13         # attenuation dead zone, ft
LAUNCH = 1000   # launch cable length, ft
PIGTAIL = 5     # pigtail length between the panel connector and the splice, ft
print(f"launch cable {LAUNCH} ft vs attenuation dead zone {ADZ} ft: {'OK' if LAUNCH > 5 * ADZ else 'too short'}")
if PIGTAIL < ADZ:
    print(f"splice {PIGTAIL} ft after the panel connector is inside the {ADZ} ft attenuation dead zone:")
    print("  the OTDR reports the connector and splice together as one event")
else:
    print("splice can be measured separately")
for pulse_ns, adz in ((5, ADZ), (30, ADZ * 3), (100, ADZ * 8)):
print(f"pulse {pulse_ns:3d} ns: attenuation dead zone about {adz:.0f} ft")launch cable 1000 ft vs attenuation dead zone 13 ft: OK splice 5 ft after the panel connector is inside the 13 ft attenuation dead zone: the OTDR reports the connector and splice together as one event pulse 5 ns: attenuation dead zone about 13 ft pulse 30 ns: attenuation dead zone about 39 ft pulse 100 ns: attenuation dead zone about 104 ft
The Riverside pigtails are about 5 ft long between the panel connector and the splice in the tray. That is inside the attenuation dead zone, so the OTDR shows the panel connector and the pigtail splice as one combined event. This is normal for pigtailed links and is why the specification evaluates the combined event at each end against an allowance for a connector plus a splice. The splices in the middle of a link, such as a repair splice in a handhole, appear as separate events.
Settings: wavelength, pulse width, range and averaging
An OTDR test is set up with four main settings. Wavelength: test singlemode at 1310 nm and 1550 nm and multimode at 850 nm and 1300 nm, for the same reasons as loss testing. Pulse width: short pulses give short dead zones and fine resolution, but carry little energy, so the trace becomes noisy over long distances; long pulses reach further but blur events together. Range: the distance window the trace covers, set to more than the length of launch cable, link and receive cable together. Averaging time: the OTDR repeats the measurement many times and averages, so longer averaging gives a cleaner trace.
Most certification OTDRs have an automatic mode that chooses these settings and a pass-fail analysis against limits for each kind of event. Hollis uses the automatic mode for production testing and switches to manual settings to investigate anything odd: a short pulse to separate events close together, or a long pulse and long averaging to see past a high-loss event. For Riverside, the specification asks for the shortest pulse that gives a clean trace to the end of the receive cable, at both wavelengths and from both ends.
Why splices are measured in both directions
An OTDR measures a splice's loss from the change in backscatter on each side. That works only if the fibers on both sides scatter the same amount of light. If the fiber after the splice has a slightly different backscatter coefficient, for example a different mode field diameter, as lesson 8 explained, the step on the trace includes that difference as well as the real loss. Measured from one direction, the splice looks worse than it is; from the other, it looks better, and it can even appear as a gain, a step up, which is physically impossible as a loss. These are called gainers.
The true splice loss is the average of the two directions. That is why Tier 2 testing of splices is done from both ends of the link, and why the OTDR software has a bidirectional analysis that pairs the events and averages them. The code below averages the results for the Riverside OS2 strands where a single-direction reading looked odd.
# Bidirectional splice analysis: average A-to-B and B-to-A readings
readings = {  # strand: (event loss from 1A, event loss from the gym), dB at 1310 nm
    "OS2-03 handhole 1 splice": (0.11, -0.07),
    "OS2-09 handhole 1 splice": (-0.04, 0.10),
    "OS2-14 handhole 1 splice": (0.06, 0.04),
    "OS2-20 handhole 1 splice": (0.21, 0.17),
}
LIMIT = 0.15   # dB, the crew's acceptance level for a fusion splice
for name, (a, b) in readings.items():
    avg = (a + b) / 2
    gainer = " (gainer in one direction)" if min(a, b) < 0 else ""
    verdict = "accept" if avg <= LIMIT else "remake"
print(f"{name}: {a:+.2f} and {b:+.2f} dB -> true loss {avg:.3f} dB, {verdict}{gainer}")OS2-03 handhole 1 splice: +0.11 and -0.07 dB -> true loss 0.020 dB, accept (gainer in one direction) OS2-09 handhole 1 splice: -0.04 and +0.10 dB -> true loss 0.030 dB, accept (gainer in one direction) OS2-14 handhole 1 splice: +0.06 and +0.04 dB -> true loss 0.050 dB, accept OS2-20 handhole 1 splice: +0.21 and +0.17 dB -> true loss 0.190 dB, remake
The Riverside cable was ordered as one length between buildings, but one section of conduit was damaged by a contractor's excavation after the pull, so the cable was cut and re-spliced in handhole 1, a mid-span splice closure with all 36 strands. Strands 03 and 09 show gainers: one direction reads a gain, the other a loss larger than the real one, and the averages are small. Strand 20 is genuinely high from both directions, with an average of 0.19 dB, above the crew's acceptance level, so Hollis remakes that splice in the closure and retests it.
Reading events and faults
| What the trace shows | Likely cause | Next step |
|---|---|---|
| Reflective spike with a step | Connector or mechanical splice | Check loss and reflectance against the limits |
| Non-reflective step | Fusion splice, or a bend | Compare 1310 and 1550 nm: a bend has more loss at 1550 |
| Large reflective spike, then noise floor | End of fiber, or a break | Compare the distance with the expected length |
| Gain step in one direction | Fibers with different backscatter | Average with the other direction |
| Steady slope steeper than expected | Wrong fiber type, or stressed cable | Check the cable and the settings |
| Ghost spike at an impossible distance | Echo of a strong reflection | Ignore after confirming; clean the strong reflector |
Ghosts deserve a note. A very strong reflection, often a dirty or open connector, can bounce back and forth in the fiber and produce an echo on the trace at a multiple of its distance, sometimes beyond the end of the fiber. A ghost has no loss step after it, and it moves if the launch cable is changed. Cleaning the strong reflector usually makes it disappear.
The OTDR also finds faults that loss testing only hints at. At Riverside, strand OS2-17 has an extra 0.42 dB at 1550 nm and almost nothing at 1310 nm, at a distance that matches handhole 2. That is a bend, and the capstone follows its repair.
# Converting OTDR event times to distances and finding where they are on the route
C = 299_792_458
NG = 1.4680                       # group index from the data sheet, 1310 nm
LAUNCH = 984                 # launch cable, ft
events_us = {"link start (1A panel)": 2.9380, "handhole 1 splice": 4.3287,
             "handhole 2 bend (1550 only)": 5.3668, "link end (gym panel)": 6.1601}
TOUNIT = 3.28084
start = C * events_us["link start (1A panel)"] * 1e-6 / (2 * NG) * TOUNIT
print(f"launch cable on the reel label: {LAUNCH} ft; measured to the link start: {start:.1f} ft")
for name, t in events_us.items():
    d = C * t * 1e-6 / (2 * NG) * TOUNIT
print(f"{name:28s} {d:8.1f} ft from the OTDR, {abs(d - start):7.1f} ft into the link")launch cable on the reel label: 984 ft; measured to the link start: 984.2 ft link start (1A panel) 984.2 ft from the OTDR, 0.0 ft into the link handhole 1 splice 1450.1 ft from the OTDR, 465.9 ft into the link handhole 2 bend (1550 only) 1797.9 ft from the OTDR, 813.7 ft into the link link end (gym panel) 2063.7 ft from the OTDR, 1079.4 ft into the link
The link starts where the launch cable ends, so the OTDR measures the launch cable's fiber length first and reports each event as a distance into the link. The fiber length between the two panels comes out about 1,079 ft, about three percent more than the 1,050 ft route length, because of the fiber's extra length in the tubes and the slack loops left in each handhole and at each end. Hollis records the OTDR length on the report alongside the route length so nobody later mistakes the difference for an error.
Worked problem
A break or the end?
During testing from the gymnasium, the OTDR shows one OS2 strand ending with a large reflection at 614 ft into the link, followed by the noise floor. The link is about 1,079 ft of fiber. What does this mean, and where should Hollis look?
Show solution
- The strand should continue to 1,079 ft and then show the receive cable; ending at 614 ft means the light stops there.
- A large reflection at the end usually means a clean break or an open connector, not a crush.
- From the event table, 614 ft is near handhole 1, where the mid-span splice closure is.
- The likely cause is a splice that broke in the closure, or a fiber broken in the tray when the closure was sealed.
Answer: Hollis opens the handhole 1 closure, finds the strand broken at the edge of its tray, re-splices it, and retests from both ends.
Common mistakes
MistakeTesting without launch and receive cables.
InsteadUse them, so the first and last connectors of the link can be measured.
MistakeJudging a splice from one direction.
InsteadMeasure from both ends and average; single readings include backscatter differences.
MistakeUsing a long pulse on a short link.
InsteadUse the shortest pulse that gives a clean trace, to keep dead zones short.
MistakeLeaving the group index at the default.
InsteadSet it from the cable data sheet so distances are right.
MistakeReporting a ghost as a fault.
InsteadCheck for a missing loss step and clean the strong reflector first.
Summary and key terms
- An OTDR measures backscattered light over time to show events along a fiber from one end.
- Slopes show fiber attenuation, steps show loss, and spikes show reflections; distance comes from time and group index.
- Dead zones after reflections hide nearby events; launch and receive cables let the end connections be measured.
- Wavelength, pulse width, range and averaging decide what the trace shows.
- Splice loss is the average of measurements from both ends, because one direction can show gainers.
- Bends show more loss at 1550 nm; breaks show a large reflection and the end of the trace.
- OTDR fiber length is usually a little longer than the cable or route length.
- OTDR
- An instrument that measures backscatter and reflections over time to locate events along a fiber.
- Backscatter
- Light scattered back toward the source by small variations in the glass.
- Event dead zone
- The shortest distance after a reflection at which another reflective event can be detected.
- Attenuation dead zone
- The distance after a reflection at which another event's loss can be measured.
- Launch cable
- A reel of fiber placed between the OTDR and the link so the first connector can be measured.
- Gainer
- A splice that appears to add power when measured from one direction.
- Group index
- The refractive index used to convert OTDR time into distance.
Practice problems
Work each problem on paper first, then reveal the answer to check.
An event returns 2.0 µs after the pulse. With n = 1.468, how far away is it?
Show answer
d = 3.0×10⁸ × 2.0×10⁻⁶ ÷ (2 × 1.468) ≈ 204 m, or about 670 ft.
A splice reads +0.12 dB from one end and −0.04 dB from the other. What is its loss?
Show answer
(0.12 − 0.04) ÷ 2 = 0.04 dB.
Why can't the panel connector and a splice 5 ft behind it be measured separately?
Show answer
The splice is inside the attenuation dead zone of the connector's reflection.
What does a step with more loss at 1550 nm than at 1310 nm usually indicate?
Show answer
A bend.
Lesson quiz · 5 questions
Score 60% or more to complete this lesson.
Create a free account to save your progress, take quizzes and earn a certificate.