
ITIL-110 · Lesson 8 of 12 · 32 min
The service relationship model, supply chains and ecosystems
No organization provides services entirely on its own. A hospital depends on electricity, network carriers, software vendors, medical device makers and staffing agencies. A small online shop depends on a hosting platform, a payment processor, a courier and a marketing tool. Each of these is a service relationship, and together they form chains and networks through which value flows. This lesson explains the service relationship model, the idea of supply chains and ecosystems, the different kinds of relationship organizations have with suppliers and partners, and the arithmetic of dependencies.
The service relationship model
Lesson 3 showed that provider and consumer are roles, and that the same organization plays both in different relationships. The service relationship model makes this explicit. An organization receives services from its providers, combines them with its own resources to create new products and services, and provides those to its consumers, who may in turn use them to serve their own customers.
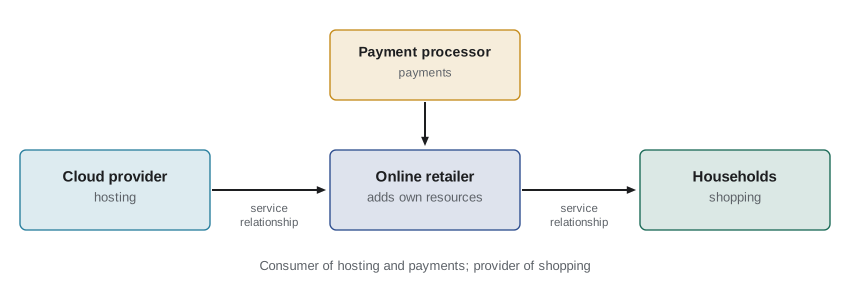
In this model, the outputs of one relationship become resources in the next. The retailer's hosting service is a resource in its shopping product. The retailer's shopping service is, in turn, a resource in a household's weekly routine. Problems and improvements travel along the chain: a faster payment processor improves the retailer's checkout, which improves the household's experience.
Supply chains, value networks and ecosystems
When relationships form a sequence, people speak of a supply chain. In digital services, the structure is usually more of a network than a chain: many providers and consumers connected in many directions, often called a value network or service ecosystem. A mobile app ecosystem, for example, connects device makers, operating system vendors, app developers, payment providers, advertisers, network operators and users.
| Structure | Description | Example |
|---|---|---|
| Supply chain | A sequence of relationships from raw resources to the final consumer | Cloud provider → software company → business customer |
| Value network | Many organizations co-creating value through multiple relationships | A hospital, its suppliers, insurers and patient apps |
| Service ecosystem | A broad network around a platform or industry, with many independent participants | An app store with developers, payment providers and users |
ITIL (Version 5) gives more attention to these digital ecosystems, recognizing that value is often co-created by many organizations at once and that no single party controls the whole experience.
Suppliers and partners
Organizations relate to their providers in different ways. A useful spectrum runs from basic relationships, through cooperative ones, to partnerships:
- Basic relationships: the provider offers standard, often commodity services, and the consumer takes them largely as they are. Buying a standard cloud storage plan is an example. Relationship management is light.
- Cooperative relationships: provider and consumer work together more closely, sharing some information and adapting offerings. A managed service provider running a client's network with regular reviews is an example.
- Partnerships: the parties share goals, risks and sometimes rewards, plan jointly and invest in the relationship. A hospital and a technology firm jointly developing a new patient system are partners.
| Feature | Basic | Cooperative | Partnership |
|---|---|---|---|
| Offering | Standard | Adapted | Co-designed |
| Information shared | Minimal | Operational | Strategic |
| Goals | Separate | Aligned | Shared |
| Risk | Each party bears its own | Some sharing through agreements | Shared, sometimes with shared rewards |
| Relationship effort | Low | Moderate | High |
No type is best in all situations. A partnership with every supplier would be exhausting and expensive. Organizations usually reserve partnerships for the few relationships most critical to their strategy and keep commodity services basic. The skill lies in choosing the right type for each relationship and investing accordingly.
Worked problem
Choosing relationship types
A regional credit union depends on: a core banking software vendor that customizes the system for it; a cloud email service used as standard; an office cleaning company; and a fintech start-up co-developing a new mobile lending feature with shared revenue. Suggest a relationship type for each.
Show solution
- Core banking vendor: cooperative, moving toward partnership, because the system is critical and customized.
- Cloud email: basic, because the service is standard and easily replaceable.
- Office cleaning: basic.
- Fintech start-up: partnership, because goals, risks and revenue are shared.
Answer: Basic for email and cleaning; cooperative for core banking; partnership for the co-developed lending feature.
Dependencies and their arithmetic
When a service depends on several others in series, all of them must work for the service to work. The availability of the combined service is roughly the product of the individual availabilities. This explains why a service built on many components can be less available than any one of them.
Worked problem
Availability of a chain
An online ordering service depends on: the retailer's own application (99.9 %), a hosting platform (99.95 %), a payment processor (99.9 %) and a delivery-tracking service (99.5 %). All four must work for an order to be completed and tracked. Estimate the end-to-end availability and the downtime per year.
Show solution
- Multiply: 0.999 × 0.9995 × 0.999 × 0.995.
- 0.999 × 0.9995 ≈ 0.998500.
- 0.998500 × 0.999 ≈ 0.997501.
- 0.997501 × 0.995 ≈ 0.992514, or about 99.25 %.
- Downtime per year: (1 − 0.992514) × 8,760 h ≈ 65.6 hours.
Answer: About 99.25 % end to end, roughly 66 hours of disruption a year, much worse than any single component's target. The weakest link (99.5 %) dominates.
Redundancy works the other way. If a service can use either of two independent components, it fails only when both fail. The combined availability is then one minus the product of their unavailabilities.
Worked problem
Adding a second payment processor
The retailer adds a second, independent payment processor (also 99.9 %), switching automatically if the first fails. What is the availability of the payment step, and what is the new end-to-end figure?
Show solution
- Payment step: 1 − (0.001 × 0.001) = 1 − 0.000001 = 0.999999.
- New chain: 0.999 × 0.9995 × 0.999999 × 0.995.
- 0.999 × 0.9995 ≈ 0.998500; × 0.999999 ≈ 0.998499; × 0.995 ≈ 0.993507.
- End to end ≈ 99.35 %, about 56.9 hours of downtime a year.
Answer: The payment step becomes almost always available, and end-to-end availability improves from about 99.25 % to 99.35 %. The tracking service at 99.5 % is now the clearest target for improvement.
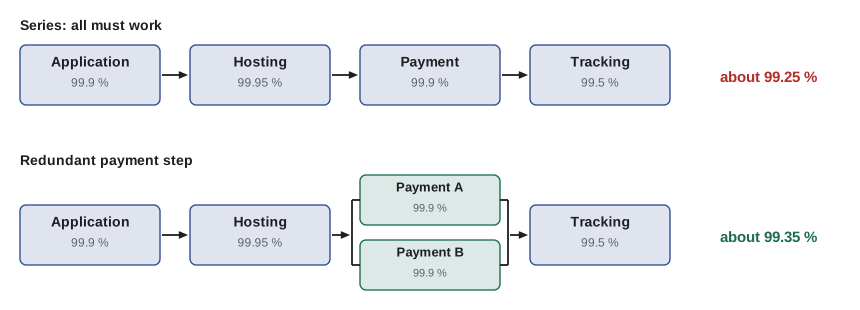
These calculations assume failures are independent, which is not always true. Two payment processors hosted in the same cloud region may fail together. Real availability planning looks for such common causes. The simple formulas are still valuable for showing why chains are fragile and where redundancy helps most.
Managing an ecosystem of providers
As the number of providers grows, coordinating them becomes a challenge of its own. Some organizations appoint a service integrator, an internal team or external firm that manages multiple providers as a single, coherent service for consumers. This approach is often called service integration and management (SIAM). Whatever the model, a few habits help:
- Map the chain: know which providers each critical service depends on, including providers' own key suppliers where possible.
- Align agreements: make sure service levels in supplier contracts support the service levels promised to consumers.
- Share information: incidents and changes at one provider often affect others; agree how to communicate.
- Plan for exit: know how you would replace a provider if needed, to reduce lock-in risk.
- Review regularly: hold joint reviews for services that span several providers.
Worked problem
Aligning agreements
An IT department promises business users 99.9 % availability for a hosted HR system. The hosting contract guarantees 99.5 %, and the HR software vendor guarantees 99.9 %. Can the IT department realistically meet its promise?
Show solution
- Series availability of the two suppliers: 0.995 × 0.999 ≈ 0.994005, or about 99.4 %.
- The IT department's own components can only lower this further.
- 99.4 % is below the promised 99.9 %.
Answer: No. The promise to users is not supported by the supplier agreements. The department should negotiate a better hosting guarantee, add redundancy or set a realistic target.
Dependencies beyond technology
Supply chains are not only about technology. Services depend on people, information and organizations as well. A call center outsourced to a partner depends on that partner's staffing levels and training. A payroll service depends on accurate data from the consumer's HR system. A delivery service depends on roads, weather and local regulations. When mapping a service, include these non-technical dependencies too, because they fail just as often and are frequently overlooked.
Geography and law matter as well. A provider may rely on staff or data centers in another country, which affects data protection, time zones for support and exposure to local events. Organizations in regulated sectors, such as health and finance, are often required to understand and manage these dependencies, including those of their providers' own key suppliers. Regulators increasingly speak of "third-party risk" or "outsourcing risk" and expect organizations to have plans for a supplier failing or leaving the market.
| Dependency type | Example | Typical control |
|---|---|---|
| Technology | Hosting platform | SLA, redundancy, monitoring |
| People | Outsourced service desk staff | Staffing commitments, training standards |
| Information | Employee data feed for payroll | Data quality checks, cut-off times |
| Organizations | Key subcontractor of a supplier | Contract clauses, supplier reviews |
| Location and law | Data stored in another country | Data residency terms, legal review |
Worked problem
Cost of a dependency failing
A contact center partner handles 2,000 customer calls a day for a utility company. If the partner suffers a one-day outage and the utility can handle only 25 % of calls with its own staff, and each unanswered call leads to a follow-up costing $4 later, what is the cost of the outage in follow-ups?
Show solution
- Calls handled in-house: 0.25 × 2,000 = 500.
- Calls unanswered: 2,000 − 500 = 1,500.
- Follow-up cost: 1,500 × $4 = $6,000.
Answer: About $6,000 in follow-up costs from one day, before counting customer frustration. Contingency plans for critical partners are part of managing the supply chain.
A dependency map does not need to be complicated to be useful. A simple diagram showing each critical service, the internal teams and external suppliers it relies on, and the agreed service levels at each link, is often enough to reveal single points of failure and mismatched promises. Reviewing the map once a year, and whenever a major supplier changes, keeps it accurate.
Mapping also supports conversations with sponsors. Showing that a promised availability target depends on a supplier contract that falls short turns an abstract risk into a concrete decision: pay for a better contract, add redundancy, or agree a lower target with consumers. Each choice has a cost, and the map makes that cost visible.
Common mistakes
MistakeAssuming a service is as available as its most reliable component.
InsteadMultiply availabilities in series; the chain is weaker than its parts.
MistakeTreating every supplier as a strategic partner.
InsteadMatch the relationship type to the importance and nature of the service.
MistakePromising consumers more than supplier contracts support.
InsteadAlign service levels along the chain.
MistakeAssuming redundant components always fail independently.
InsteadLook for common causes such as shared hosting regions.
MistakeIgnoring providers' own suppliers.
InsteadMap critical dependencies as far along the chain as practical.
Summary and key terms
- The service relationship model shows organizations as consumers of some services and providers of others, linked in chains.
- Outputs of one relationship become resources in the next.
- Digital services often form value networks or ecosystems rather than simple chains.
- Relationships range from basic to cooperative to partnership; each suits different situations.
- Availability of components in series is the product of their availabilities.
- Redundancy in parallel greatly reduces the chance of failure if failures are independent.
- Coordinating many providers needs mapping, aligned agreements, shared information and exit plans.
- Service relationship model
- A view of organizations as consumers and providers linked through chains of service relationships.
- Supply chain
- A sequence of relationships from resources to the final consumer.
- Value network
- A network of organizations co-creating value through multiple relationships.
- Service ecosystem
- A broad network of independent participants around a platform or industry.
- Supplier
- A stakeholder responsible for providing services that are used by an organization.
- Partnership
- A relationship with shared goals, risks and often rewards.
- Series dependency
- Components that must all work for a service to work.
- Redundancy
- Duplicate components so that one can take over if another fails.
- SIAM
- Service integration and management: coordinating multiple providers as one service.
- Common cause failure
- A single event that causes several supposedly independent components to fail.
Practice problems
Work each problem on paper first, then reveal the answer to check.
What does the service relationship model show?
Show answer
Organizations as consumers and providers linked in chains of relationships.
Name the three relationship types on the spectrum.
Show answer
Basic, cooperative and partnership.
Which type suits a standard cloud email plan?
Show answer
Basic.
Availability of two 99 % components in series?
Show answer
0.99 × 0.99 = 98.01 %.
Availability of two independent 99 % components in parallel?
Show answer
1 − 0.01 × 0.01 = 99.99 %.
Downtime per year at 99.25 %?
Show answer
0.0075 × 8,760 ≈ 65.7 hours.
Why might two redundant processors fail together?
Show answer
A common cause, such as both being hosted in the same region.
What is SIAM?
Show answer
Service integration and management of multiple providers.
Hosting 99.5 % and software 99.9 % in series gives about what?
Show answer
About 99.4 %.
Name two habits for managing many providers.
Show answer
For example mapping dependencies and aligning agreements.
Lesson quiz · 5 questions
Score 60% or more to complete this lesson.
Create a free account to save your progress, take quizzes and earn a certificate.