
ITIL-110 · Lesson 12 of 12 · 30 min
Capstone: mapping a service's value proposition
This final lesson brings the whole course together. You will follow a fictional organization as it maps the value proposition of a new service using every key concept: value and co-creation, organizations and roles, products and offerings, outcomes, outputs, costs and risks, utility and warranty, relationships and supply chains, experience and measurement. The aim is to show how the vocabulary works as a toolkit for thinking, not just a list of definitions to memorize for the exam. The lesson ends with a checklist you can use on any service and a short review of how the key concepts are tested.
The scenario
Lakeside Community Health is a fictional network of eight clinics serving about 120,000 patients. Patients book appointments by phone, and the call center is overwhelmed: on Monday mornings the average wait is 25 minutes and about 18 % of callers hang up before reaching anyone. Lakeside plans an online booking service, with a mobile-friendly website, reminders by text and email, and a simple way to cancel or reschedule. The service will run on a software-as-a-service booking platform, integrated with the clinics' scheduling system, and will use a text-messaging provider for reminders.
The project sponsor has asked the service owner to produce a one-page value proposition map before the contract is signed. The map must show who is involved, what value each party expects, what Lakeside will offer, how success will be judged and what could go wrong.
Step 1: Stakeholders and roles
The first step is to identify the organizations involved and the roles they play.
| Stakeholder | Role in the service | What value means to them |
|---|---|---|
| Patients | Users (and, for themselves, customers) | Book quickly at a convenient time; fewer missed appointments |
| Clinic managers | Customers | Fuller schedules, fewer no-shows, less front-desk pressure |
| Chief operating officer | Sponsor | Lower call-center cost, better access, value for money |
| Call-center and front-desk staff | Users (internal) and stakeholders | Fewer routine calls; time for complex patient needs |
| Lakeside IT team | Service provider (internal) | A service that is reliable, secure and supportable |
| Booking platform vendor | Supplier | Revenue and a reference customer |
| Text-messaging provider | Supplier | Message volume and revenue |
| Privacy regulator and the public | Stakeholders | Personal health information protected; equitable access |
Note that Lakeside is both a consumer (of the platform and messaging services) and a provider (of booking to patients), illustrating the service relationship model from lesson 8.
Step 2: The offering
Next, describe what patients will be offered, using the components from lesson 4.
- Access to resources: the online booking site and app features, available around the clock; patient accounts.
- Service actions: sending reminders, confirming bookings, helping patients by phone if they get stuck, rebooking when a clinician is unavailable.
- Goods: none for patients. (If Lakeside later offered tablets in clinic waiting rooms for self check-in, those would be goods owned by Lakeside, not given to patients.)
The product behind this offering is the configuration of the booking platform, integration with clinic schedules, messaging, the call center and support processes, and the staff who run them. The service enables an outcome patients want, a confirmed appointment at a suitable time, without patients managing the costs and risks of scheduling systems.
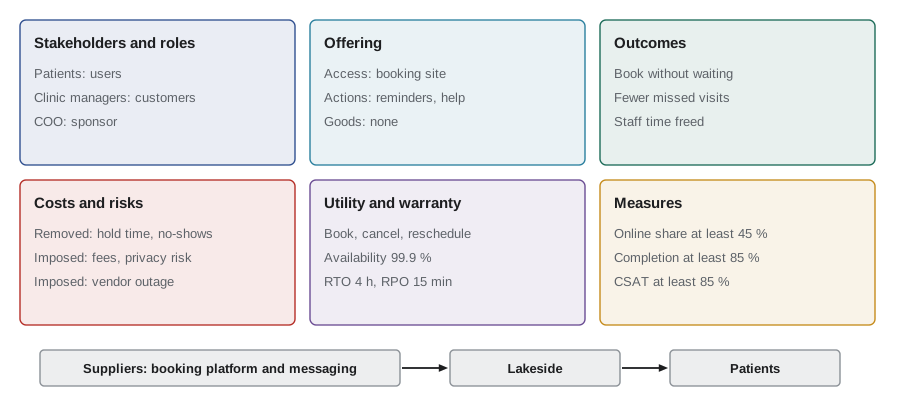
Step 3: Outcomes and outputs
Lakeside separates outputs, which it controls, from the outcomes it hopes they will enable.
| Output | Outcome | For whom |
|---|---|---|
| Online booking available 24/7 | Patients book without waiting on the phone | Patients |
| Reminders sent 48 hours and 2 hours before | Fewer missed appointments | Patients and clinics |
| Easy online cancellation | Freed slots offered to other patients | Clinics and other patients |
| Fewer routine calls | Staff time freed for complex needs | Staff and patients with complex needs |
Step 4: Costs and risks
Lakeside then lists costs and risks removed and imposed, for patients and for the organization.
| Removed | Imposed | |
|---|---|---|
| Patients: costs | Time on hold; travel to book in person | Need for a device and internet access; learning the site |
| Patients: risks | Forgetting appointments | Privacy concerns about online health data |
| Lakeside: costs | Call-center overtime; no-show waste | Platform subscription; messaging fees; integration; training |
| Lakeside: risks | Staff burnout from call volume | Vendor outage; data breach; patients excluded by digital-only design |
Worked problem
Estimating the financial case
The call center handles 180,000 booking calls a year at an average cost of $6 per call. Lakeside expects 45 % of bookings to move online. No-shows currently waste about 9,000 appointments a year, valued at $80 each, and reminders are expected to cut no-shows by 30 %. The platform costs $60,000 a year, messaging about $18,000 a year, and first-year integration and training $50,000. Estimate the annual benefit, the ongoing cost and the first-year net result.
Show solution
- Calls avoided: 0.45 × 180,000 = 81,000; saving 81,000 × $6 = $486,000.
- No-shows avoided: 0.30 × 9,000 = 2,700; value 2,700 × $80 = $216,000.
- Annual benefit: $486,000 + $216,000 = $702,000.
- Ongoing cost: $60,000 + $18,000 = $78,000 a year.
- First year: $702,000 − $78,000 − $50,000 = $574,000 net.
Answer: Roughly $702,000 of annual benefit against $78,000 ongoing cost, or about $574,000 net in year one. The call-center saving assumes staff time is redeployed rather than cut, so part of it may appear as better service instead of cash.
Worked problem
Weighing a key risk
Lakeside estimates a 3 % annual chance of a privacy breach involving the booking service, with an impact of $1.5 million (notification, legal costs, lost trust). Stronger controls, including multi-factor login for staff and a security review of the vendor, would cost $40,000 a year and cut the chance to 1 %. Are the controls worth it on expected-loss grounds?
Show solution
- Expected loss without controls: 0.03 × $1,500,000 = $45,000.
- Expected loss with controls: 0.01 × $1,500,000 = $15,000.
- Reduction: $30,000 a year, against a cost of $40,000.
- On expected loss alone, controls cost $10,000 more than they save.
- But regulators, patients and reputation make the worst case unacceptable, and privacy law requires reasonable safeguards.
Answer: Expected loss alone does not justify the full cost, but legal duties and the severity of a breach do. This shows why value judgments consider stakeholders beyond simple arithmetic.
Step 5: Utility and warranty requirements
The team writes down what the service must do and how well it must do it.
- Utility: book, cancel and reschedule appointments for any clinic and clinician type offered online; send reminders; let patients see upcoming appointments; support family members booking for children or dependants.
- Warranty: availability of 99.9 % for booking; capacity for 3 times normal peak at flu-season launch; pages loading in under 3 seconds for 95 % of requests; strong security and privacy controls; recovery within 4 hours and no more than 15 minutes of data loss.
Worked problem
Checking the chain
The booking flow depends on the platform (SLA 99.95 %), the integration with clinic schedules run by Lakeside IT (estimated 99.8 %) and the clinics' scheduling system (99.9 %). Reminders depend on the messaging provider but are not needed to complete a booking. Can the booking flow meet 99.9 %?
Show solution
- Series availability: 0.9995 × 0.998 × 0.999.
- 0.9995 × 0.998 ≈ 0.997501; × 0.999 ≈ 0.996503.
- About 99.65 %, below the 99.9 % target.
- The weakest link is Lakeside's own integration at 99.8 %.
Answer: No. The chain gives about 99.65 %. Lakeside should improve the integration (for example with monitoring, automatic retries and a queue) or set a realistic target with consumers.
Step 6: Relationships and experience
Lakeside plans its relationships: a cooperative relationship with the booking vendor, with monthly service reviews and a shared roadmap; a basic relationship with the messaging provider; and regular reviews with clinic managers as customers. A responsibility matrix clarifies who handles what, for example the vendor fixes platform faults, Lakeside IT handles integration, clinics keep schedules accurate, and patients keep contact details up to date.
For experience, the team maps a patient journey for a parent booking a child's vaccination, testing it with real parents, older adults and people using screen readers. They keep phone booking for those who need it and plan to make the site meet WCAG accessibility guidelines from the start.
Step 7: Measures
Finally, Lakeside sets measures linked to value.
| CSF | KPI | Target in year 1 |
|---|---|---|
| Patients can book easily online | Share of bookings made online | ≥ 45 % |
| Patients can book easily online | Booking completion rate (started vs finished) | ≥ 85 % |
| Phone access improves for those who need it | Average Monday wait time | ≤ 8 minutes |
| Appointments are used | No-show rate | 30 % lower than baseline |
| The service is dependable | Booking availability | ≥ 99.9 % |
| Patients are satisfied | CSAT after booking | ≥ 85 % |
The team also writes one OKR for the first quarter after launch: Objective: "Make booking a clinic visit quick and stress-free for every patient." Key results: online share from 0 % to 30 %; Monday wait time from 25 to 12 minutes; booking completion rate at least 80 %.
Worked problem
Reviewing the first quarter
After the first quarter, the online share is 27 %, the Monday wait is 14 minutes and the completion rate is 84 %. Score each key result by progress (0 to 1, capped at 1) and give the average.
Show solution
- Online share: (27 − 0) ÷ (30 − 0) = 0.90.
- Wait time: (25 − 14) ÷ (25 − 12) = 11 ÷ 13 ≈ 0.85.
- Completion: target was at least 80 % and 84 % was achieved, so 1.0 (capped).
- Average: (0.90 + 0.85 + 1.0) ÷ 3 ≈ 0.92.
Answer: About 0.92: a strong start. The next step is to understand why the remaining 16 % of patients abandon bookings, using analytics and journey research.
A checklist for any service
- Who are the stakeholders, and who plays the customer, user and sponsor roles?
- What is the product, and what offering is presented to each consumer group: goods, access and service actions?
- What outputs will the provider produce, and what outcomes should they enable?
- Which costs and risks are removed from consumers, and which are imposed?
- What utility is needed, and what warranty: availability, capacity, security, continuity and performance?
- Which suppliers and partners are in the chain, and do their agreements support the promises made?
- What does the consumer journey look like, and where are the moments of truth?
- Which CSFs, KPIs and OKRs will show whether value is co-created, without creating watermelons?
How the key concepts are tested
At Foundation level, expect questions that ask you to recognize definitions (for example, which term means "a configuration of an organization's resources designed to offer value for a consumer"), to classify examples (is this an output or an outcome? goods, access or a service action? utility or warranty?) and to identify roles (customer, user or sponsor). Scenario-style questions, like the examples in this course, test whether you can apply the vocabulary. ITIL-101 covers the exam format, and ITIL-160 covers exam technique and practice papers. Remember to confirm which edition, ITIL 4 or ITIL (Version 5), your exam is based on.
Common mistakes
MistakeTreating the key concepts as a list to memorize only for the exam.
InsteadUse them as a toolkit for analyzing real services.
MistakeBuilding a business case on cost savings alone.
InsteadInclude outcomes, risks, experience and stakeholders such as regulators and the public.
MistakeSetting a warranty target without checking the supply chain.
InsteadMultiply availabilities along the chain and fix the weakest link.
MistakeDesigning a digital-only service for everyone.
InsteadKeep alternative channels and design for accessibility.
MistakeMeasuring launch success only by adoption.
InsteadCombine adoption with completion, experience and outcome measures.
Summary and key terms
- A value proposition map brings all the key concepts together on one page.
- Start with stakeholders and the customer, user and sponsor roles.
- Describe the offering as goods, access to resources and service actions.
- Separate outputs from outcomes, and list costs and risks removed and imposed.
- State utility and warranty requirements, and check them against the supply chain.
- Plan relationships, responsibilities and the consumer journey, including accessibility.
- Link CSFs, KPIs and OKRs to value and review them regularly.
- Value proposition
- A statement of the value a service offers to its stakeholders.
- Value proposition map
- A one-page summary of stakeholders, offering, outcomes, costs, risks, requirements and measures.
- Service owner
- The person accountable for a service throughout its life.
- Business case
- A justification for investment based on expected benefits, costs and risks.
- Baseline
- The starting level of a measure before a change.
- No-show rate
- The share of booked appointments that patients miss without canceling.
- Completion rate
- The share of started transactions that are finished.
- Redeployment
- Moving staff time to other valuable work rather than cutting it.
- Integration
- Connecting systems so they exchange data automatically.
- Weakest link
- The component with the lowest availability in a series chain.
Practice problems
Work each problem on paper first, then reveal the answer to check.
In the scenario, who is the sponsor?
Show answer
The chief operating officer.
Name two service actions in the booking offering.
Show answer
For example sending reminders and phone help for stuck patients.
Give an output and the outcome it enables.
Show answer
Reminders sent; fewer missed appointments.
Name a risk imposed on patients.
Show answer
Privacy concerns about online health data.
Calls avoided if 40 % of 150,000 calls move online?
Show answer
60,000.
Expected loss of a 2 % chance of a $1 million breach?
Show answer
$20,000.
Series availability of 99.9 % and 99.9 %?
Show answer
About 99.8 %.
Progress if wait time falls from 30 to 18 with a target of 15?
Show answer
12 ÷ 15 = 0.8.
Why keep phone booking?
Show answer
To protect access for patients who cannot or prefer not to book online.
What should you confirm about the edition before your exam?
Show answer
Whether it is based on ITIL 4 or ITIL (Version 5).
Lesson quiz · 5 questions
Score 60% or more to complete this lesson.
Create a free account to save your progress, take quizzes and earn a certificate.