
HSE-341 · Lesson 1 of 12 · 27 min
Violence and robbery in retail: what the data show
Most shifts in a store pass without anyone raising a voice. But retail workers deal with the public all day, handle cash and goods that other people want, refuse sales, enforce store policies and often work early in the morning or late at night with only a few people on shift. Those features of the job make retail one of the settings where workers most often face threats, abuse, aggression and, less often, robbery. This course is about reducing those risks and responding safely when something does happen.
This is the second course in the retail sites track. HSE-340 covered the everyday physical hazards of a store: stocking, ladders, cutters, cold rooms, spills and crowds. This course covers the people hazards: robbery, aggressive and abusive customers, harassment and what to do afterwards. HSE-342 follows with the backroom. Where a topic is taught in depth elsewhere, this course points to it rather than repeating it. HSE-108 covers workplace violence and harassment law and prevention programs in every kind of workplace, and this course applies that material to stores. HSE-109 covers psychological health and safety, HSE-103 covers first aid, and HSE-352 covers working alone and late-night shifts at fuel stations and convenience stores in detail.
We continue to follow Northfield Market in Spokane, Washington, the grocery and general merchandise store from HSE-340. Northfield has about 90 workers, eight staffed checkouts, six self-checkouts, a pharmacy counter run by a separate pharmacy company, a customer service desk that handles returns, lottery and money transfers, and a beer and wine section. Store manager Priya Nair and safety lead Marco Delgado appear again, along with cashiers Ana and Rosa, stocker Omar and front-end supervisor Sam. We also meet a second, smaller invented store: Riverside Corner Market, a convenience store a few miles away that is open from 6 a.m. to midnight with two to three workers on most shifts.
What we mean by violence
In workplace safety law and practice, violence usually means more than physical assault. Most definitions include threats of force and behavior that gives a worker reasonable cause to believe they are at risk of injury. Many also bring in harassment, bullying and verbal abuse, either in the same law or in a closely related one. HSE-108 explains the definitions in detail. For a store, it is useful to think about four overlapping kinds of incident:
- Criminal intent: the person has no legitimate relationship with the store and comes to commit a crime, such as robbery, theft with violence or assault. This is the type most likely to involve a weapon and the one most strongly linked to deaths at work.
- Customer or client: a customer becomes aggressive, abusive or violent while being served, for example after a refusal, a long wait, a disputed return or a price error. This is by far the most common type in stores.
- Worker on worker: conflict, bullying or violence between people who work together. HSE-108 covers this.
- Personal relationship: someone who has a relationship with a worker, such as a current or former partner, brings violence into the workplace. HSE-108 covers domestic violence and the workplace.
Most of this course is about the first two types, because they are the ones that are specific to retail work and where store design, procedures and training make the biggest difference.
Robbery is rare; aggression is common
Two very different pictures emerge from the data. Robbery is a serious but relatively rare event in any one store. Many stores never experience a robbery, and those that do may go years between incidents. Robberies are also concentrated: convenience stores, gas stations, liquor stores, pharmacies and stores open late at night in some neighborhoods account for a large share of retail robberies. When robberies happen, though, they carry the highest risk of serious injury and death of any event in a store, and their psychological effects on workers can last for months.
Customer aggression is the opposite. Verbal abuse, shouting, swearing, threats, throwing items and pushing are everyday events in many stores. Surveys of retail workers in Canada, the United States, the United Kingdom and Australia consistently find that most frontline workers have experienced verbal abuse from customers, and a substantial share have been threatened or physically assaulted at some point. Each incident is usually less severe than a robbery, but there are many more of them, and repeated abuse wears people down. It is a major reason retail workers leave their jobs.
A good prevention program therefore does two things at once. It reduces the chance and the severity of a rare but very serious event, and it reduces the frequency and impact of common but less severe ones. The controls overlap. Clear sightlines, good lighting, enough staff, a culture of backing each other up and clear policies on refusals all help with both.
What the numbers show
The Bureau of Labor Statistics (BLS) counts fatal work injuries every year in the census of fatal occupational injuries. For 2024, released in February 2026, BLS counted 5,070 fatal work injuries in total and 470 workplace homicides, up from 458 in 2023. Homicides made up nearly two-thirds of deaths from violent acts at work. Retail workers, especially in convenience stores, gas stations and other late-night stores, have long been among the occupations with the highest numbers of workplace homicides, most of them during robberies. Workers' compensation and BLS injury surveys also show retail among the industries with many nonfatal injuries from violence by other people.
Industry surveys add another view. The National Retail Federation's October 2025 study of large retailers, conducted with the Loss Prevention Research Council, reported an 18% rise in average shoplifting incidents in 2024 and a 17% rise in threats or acts of violence during theft events compared with 2023. Treat surveys like this with care. They come from a small number of large companies (70 in this case), they rely on what loss prevention leaders report, and changes in how thefts are counted can move the numbers. They are still useful as a signal: retailers themselves report that confrontations around theft are becoming more frequent.
| Source | What it measures | Strengths | Limits |
|---|---|---|---|
| BLS census of fatal occupational injuries | Workplace homicides and other deaths | Complete count of deaths, by industry and occupation | Deaths only; small numbers in any one industry |
| BLS Survey of Occupational Injuries and Illnesses | Nonfatal injuries with days away, including from violence | National, by industry | Misses incidents without injury or time away |
| Industry surveys (for example NRF) | Theft and violence reported by retailers | Recent; asks about trends and controls | Small samples of large companies; self-reported |
| Store incident logs | Every reported incident in your store | Specific and actionable | Under-reporting is common, especially of verbal abuse |
Under-reporting
Every source above undercounts. Workers often do not report verbal abuse because they see it as part of the job, because nothing happened last time they reported, because the report form takes too long, or because they worry about being blamed for causing the incident. Younger workers in particular may not know that being sworn at or threatened is something to report. Supervisors may discourage reports without meaning to, for example by asking first what the worker did to upset the customer.
Under-reporting matters because the store's own incident log is the most useful information it has. If verbal abuse at the customer service desk peaks on Saturday afternoons, or if most threats follow refusals of alcohol sales, the store can act on that. If nobody reports, the log shows a quiet store and nothing changes. One of the first jobs of a prevention program is therefore to make reporting quick, safe and worthwhile, and to show workers what was done with their reports.
Northfield's incident log
When Marco Delgado reviewed Northfield's incident log for the past year, he found 61 reported incidents involving customers. Most were verbal abuse or threats. Several involved items being thrown or a worker being pushed. There were three thefts where the person threatened staff on the way out, and one attempted robbery at the customer service desk, in which a man claimed to have a weapon and left with cash from the lottery drawer. Nobody was physically hurt in the robbery, but the cashier involved took two weeks off and later moved to a different department.
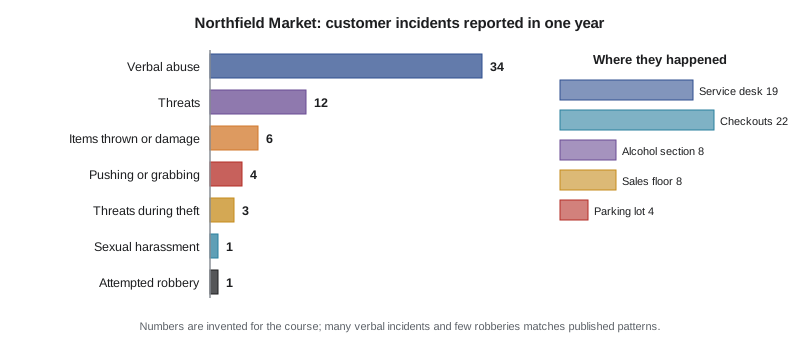
Marco also noticed what was missing. Almost all reports came from three workers, which suggested many others were not reporting. Nearly a third of incidents happened at the customer service desk, which handles returns, lottery and money transfers. Most of the rest happened at the checkouts, with clusters after refusals of alcohol sales and around self-checkout disputes. Evening shifts on Fridays and Saturdays had more incidents per hour worked than any other time.
Measuring violence in a store
A simple rate makes it possible to compare departments, stores and years even when the number of people working changes. One common approach counts incidents per 100 full-time equivalent (FTE) workers per year, where one FTE is about 2,000 hours. Another counts incidents per 10,000 customer transactions, which is useful for front-end staff because their exposure depends on how many customers they serve. The program below calculates both from a synthetic monthly log and fits a simple trend.
# Customer incident rates from a synthetic 12-month log (numbers are invented).
import random
random.seed(41)
months = ["Jan","Feb","Mar","Apr","May","Jun","Jul","Aug","Sep","Oct","Nov","Dec"]
hours = [13800, 13200, 14100, 14000, 14600, 14900, 15200, 15100, 14300, 14200, 15800, 17800]
txns  = [61000, 58000, 63000, 62500, 66000, 68000, 70500, 69800, 64000, 63500, 72000, 84000]
incidents = [random.choice([3,4,5,5,6]) for _ in months]
incidents[10] += 2; incidents[11] += 4      # holiday season
total_h, total_i, total_t = sum(hours), sum(incidents), sum(txns)
fte = total_h / 2000
print(f"Incidents: {total_i}   Hours: {total_h:,}   FTE: {fte:.1f}")
print(f"Rate per 100 FTE per year: {100 * total_i / fte:.1f}")
print(f"Rate per 10,000 transactions: {10000 * total_i / total_t:.2f}")
# least-squares trend in incidents per 10,000 transactions
r = [10000 * i / t for i, t in zip(incidents, txns)]
n = len(r); xbar = (n - 1) / 2; ybar = sum(r) / n
slope = sum((x - xbar) * (y - ybar) for x, y in enumerate(r)) / sum((x - xbar) ** 2 for x in range(n))
print(f"Trend: {slope:+.3f} incidents per 10,000 transactions per month")
for m, i, t in zip(months, incidents, txns):
print(f" {m}: {i:2d} incidents, {10000 * i / t:.2f} per 10,000 transactions")Incidents: 65 Hours: 177,000 FTE: 88.5 Rate per 100 FTE per year: 73.4 Rate per 10,000 transactions: 0.81 Trend: +0.015 incidents per 10,000 transactions per month Jan: 5 incidents, 0.82 per 10,000 transactions Feb: 5 incidents, 0.86 per 10,000 transactions Mar: 4 incidents, 0.63 per 10,000 transactions Apr: 4 incidents, 0.64 per 10,000 transactions May: 5 incidents, 0.76 per 10,000 transactions Jun: 6 incidents, 0.88 per 10,000 transactions Jul: 5 incidents, 0.71 per 10,000 transactions Aug: 6 incidents, 0.86 per 10,000 transactions Sep: 5 incidents, 0.78 per 10,000 transactions Oct: 5 incidents, 0.79 per 10,000 transactions Nov: 8 incidents, 1.11 per 10,000 transactions Dec: 7 incidents, 0.83 per 10,000 transactions
The overall rate looks modest, but the month-by-month figures show a clear rise in November and December, when the store is busiest, staff are newer and customers are more stressed. The trend line is positive mainly because of the holiday months. A store that only looked at the annual total would miss that pattern. A store that tracked rates by department, day and time could go further and see that the risk concentrates at particular desks and hours, which is where controls should go first.
Leading measures
Incident counts are lagging measures: they tell you what has already happened. Leading measures track the things that prevent incidents. For violence, useful leading measures include the share of workers trained in robbery response and de-escalation, the share of shifts that meet minimum staffing, the number of times the cash-handling limit is exceeded, the time taken to follow up each report, the results of staff surveys on whether they feel safe and supported, and the share of prevention actions completed on time. HSE-407 covers safety measures in general. Lesson 12 of this course puts several of them together into a store plan.
Why this matters for workers
The effects of violence go well beyond physical injury. Workers who have been robbed or threatened can experience fear, sleep problems, intrusive memories, irritability and difficulty concentrating, and a minority develop post-traumatic stress disorder. Repeated verbal abuse can lead to anxiety, low mood and burnout even when no single incident seems serious. Effects often show up days later, and they can affect co-workers who witnessed the event as well as the person directly involved. Lesson 11 covers how to support workers afterwards. HSE-109 covers psychological health and safety more broadly.
There are also effects on the business: absence, turnover, recruitment costs, lost productivity, compensation claims and damage to the store's reputation. These are real, but they are not the main reason to act. Workers have a right to a workplace where the risk of violence has been assessed and controlled, and employers have a legal duty to do that, as Lesson 2 explains.
How this course is organized
Lesson 2 covers the law and the parts of a violence prevention program. Lessons 3 to 6 deal with robbery: what makes a store a target, how store design and procedures reduce the risk, and what to do during and right after a robbery. Lessons 7 to 10 deal with customer aggression and abuse: how aggression builds, de-escalation, handling refusals, returns and shoplifting without confrontation, and harassment, hate incidents and abuse by phone or online. Lesson 11 covers care, reporting and recovery after an incident. Lesson 12 brings everything together in a risk assessment and response plan for Riverside Corner Market.
For supervisors: start with what you already know
Before changing anything, gather what the store already knows. Pull a year of incident reports, first aid records, compensation claims and police reports. Ask the front-end team, the customer service desk and the closing crew where and when they feel least safe; they will often name problems that never reached the incident log. Walk the store at opening and closing time and look at it from the parking lot. These steps take a few hours and give you a much clearer picture than any national statistic.
Worked problem
Reading the incident log
Northfield's log shows 61 customer incidents in a year: 34 verbal abuse, 12 threats, 6 items thrown or damage, 4 pushing or grabbing, 3 threats during theft, 1 sexual harassment and 1 attempted robbery. The store worked about 172,000 hours. What does the log tell Marco, and what should he do first?
Show solution
- Calculate a rate. 172,000 hours is 86 FTE, so 61 incidents is about 71 per 100 FTE per year.
- Look at the pattern, not just the total. Most incidents are verbal, but 23 involved threats, contact or items thrown, and one was a robbery.
- Look at where and when. Nearly a third happened at the customer service desk, and evening weekend shifts had the highest rate.
- Look at who reported. Almost all reports came from three workers, so the true count is likely higher.
- Act on the biggest signals: make reporting easier, review the customer service desk layout and cash handling, and check evening weekend staffing.
Answer: The log points to the customer service desk and weekend evenings as priorities and to under-reporting as a problem in itself. Marco's first steps are to make reporting easier and to review the desk and evening staffing.
Common mistakes
MistakeTreating verbal abuse as part of the job and not worth reporting.
InsteadReport verbal abuse and threats; they are violence under most workplace rules and the pattern guides prevention.
MistakeJudging the risk only by how many robberies the store has had.
InsteadLook at both rare severe events and frequent less severe ones; controls help with both.
MistakeComparing raw incident counts between busy and quiet periods.
InsteadUse rates per 100 FTE or per 10,000 transactions so periods and stores can be compared.
MistakeAsking a worker first what they did to upset the customer.
InsteadThank them for reporting, check they are safe and supported, and focus on what the store can change.
MistakeRelying on national statistics to decide what your store needs.
InsteadUse your own incident log, staff input and a walk-through to find your store’s risks.
Summary and key terms
- Retail workers face customer aggression often and robbery rarely; both need attention.
- Violence includes threats and abusive behavior that make a worker fear injury, not only physical assault.
- The four types are criminal intent, customer, worker on worker and personal relationship; this course focuses on the first two.
- National data, compensation claims and industry surveys show the scale but undercount; store logs are the most useful source.
- Under-reporting is common, especially of verbal abuse, and fixing it is an early goal of any program.
- Rates per 100 FTE or per 10,000 transactions allow fair comparisons; leading measures track prevention.
- Violence affects workers’ mental health and the business, and employers have a legal duty to address it.
- Workplace violence
- Force, threats of force or behavior at work that gives a worker reasonable cause to believe they are at risk of injury.
- Robbery
- Taking property from a person by force or by threat of force.
- Criminal intent violence
- Violence by a person with no legitimate relationship to the workplace who comes to commit a crime.
- Customer violence
- Aggression or violence by a customer while being served.
- Under-reporting
- Incidents that happen but are not recorded, which makes the risk look smaller than it is.
- FTE
- Full-time equivalent; about 2,000 hours of work in a year.
- Leading measure
- A measure of activities that prevent harm, such as training completed or staffing met.
Practice problems
Work each problem on paper first, then reveal the answer to check.
Name the four types of workplace violence used in this lesson.
Show answer
Criminal intent, customer or client, worker on worker, and personal relationship.
Which type is most strongly linked to deaths at work in retail?
Show answer
Criminal intent violence, especially robbery.
Which type is most common in stores?
Show answer
Customer aggression, mostly verbal abuse and threats.
Give two reasons workers do not report verbal abuse.
Show answer
Any two of: they see it as part of the job, nothing happened last time, the form takes too long, fear of blame, not knowing it counts.
A store worked 120,000 hours and had 30 incidents. What is the rate per 100 FTE?
Show answer
120,000 hours is 60 FTE; 30 / 60 × 100 = 50 per 100 FTE per year.
Why can industry theft surveys overstate or understate trends?
Show answer
They use small samples of large companies, rely on self-reporting and can change how incidents are counted.
Give three leading measures for violence prevention.
Show answer
Any three of: training completion, shifts meeting minimum staffing, cash limit compliance, follow-up time, staff survey results, actions completed on time.
Give two effects violence can have on workers beyond physical injury.
Show answer
Any two of: fear, sleep problems, intrusive memories, anxiety, low mood, burnout, post-traumatic stress disorder.
Lesson quiz · 5 questions
Score 60% or more to complete this lesson.
Create a free account to save your progress, take quizzes and earn a certificate.