
GEOM-499 · Lesson 8 of 12 · 20 min
Quality assessment
Quality assessment answers one question for every deliverable: does it meet the requirement it was made for, and how do we know? It is different from the internal checks in lesson 6. Those showed that the processing behaved as expected. Quality assessment uses independent evidence, such as checkpoints that never entered the processing, to test the final products against the agreed accuracy classes, and it produces the accuracy statements that go into the report and metadata. In the capstone it is also where the team's quality lead, Nadia, has to be most independent of the people who made the products.
Quality control and quality assurance
Quality control is the checking of products and data: residuals, checkpoint tests, visual inspection, comparison with other data. Quality assurance is the system that makes good results likely: the plan, the procedures, the training, the reviews and the records. Coulee Watch has both. Its quality assurance includes the methods statement, the field procedures, the processing log and the rule that every product is reviewed by a team member who did not make it. Its quality control is the set of tests in this lesson. A good quality assurance system makes quality control findings rare; it does not remove the need for them.
Testing the terrain model with checkpoints
The 32 checkpoints were surveyed independently and kept out of all processing. For each one, Nadia extracts the terrain model height at the checkpoint's horizontal position and computes the difference, model minus checkpoint. She does the same for the orthomosaic in plan, measuring the image position of each target's center and comparing it with its surveyed coordinates. ASPRS Edition 2 asks that the accuracy of the checkpoints themselves be included in the reported value, by adding the squares of the product error and the checkpoint survey error.
# Coulee Watch: accuracy of the epoch 1 terrain model and orthomosaic (ASPRS Edition 2 style)
import math, random
random.seed(8)
n = 32
dz = [random.gauss(0.006, 0.028) for _ in range(n)]           # model minus checkpoint (m)
dx = [random.gauss(0.0, 0.017) for _ in range(n)]
dy = [random.gauss(0.0, 0.019) for _ in range(n)]
rmse = lambda e: math.sqrt(sum(x * x for x in e) / len(e))
mean = lambda e: sum(e) / len(e)
s_cp_v, s_cp_h = 0.012, 0.010                                  # checkpoint survey accuracy
rz = math.sqrt(rmse(dz) ** 2 + s_cp_v ** 2)
rx, ry = rmse(dx), rmse(dy)
rh_prod = math.sqrt(rx ** 2 + ry ** 2)
rh = math.sqrt(rh_prod ** 2 + s_cp_h ** 2)
print(f"{n} checkpoints")
print(f"vertical: mean {mean(dz) * 100:+.1f} cm, product RMSEz {rmse(dz) * 100:.1f} cm, "
      f"with checkpoint error {rz * 100:.1f} cm")
print(f"horizontal: RMSEx {rx * 100:.1f} cm, RMSEy {ry * 100:.1f} cm, RMSEh {rh * 100:.1f} cm")
print("vertical class 5 cm met" if rz <= 0.05 else "vertical class 5 cm failed")
print("horizontal class 4 cm met" if rh <= 0.04 else "horizontal class 4 cm failed")
worst = max(range(n), key=lambda i: abs(dz[i]))
print(f"largest vertical error {dz[worst] * 100:+.1f} cm at checkpoint {worst + 1}")
# error budget: components that add in quadrature for the terrain model
budget = {"control": 0.010, "image matching": 0.018, "georeferencing": 0.012, "ground filtering": 0.015}
tot = math.sqrt(sum(v * v for v in budget.values()))
for k, v in budget.items(): print(f"  {k:16s} {v * 100:4.1f} cm  ({v * v / tot / tot:4.0%})")
print(f" predicted total {tot * 100:4.1f} cm")32 checkpoints vertical: mean +1.6 cm, product RMSEz 3.4 cm, with checkpoint error 3.6 cm horizontal: RMSEx 1.9 cm, RMSEy 1.7 cm, RMSEh 2.7 cm vertical class 5 cm met horizontal class 4 cm met largest vertical error +9.2 cm at checkpoint 24 control 1.0 cm ( 13%) image matching 1.8 cm ( 41%) georeferencing 1.2 cm ( 18%) ground filtering 1.5 cm ( 28%) predicted total 2.8 cm
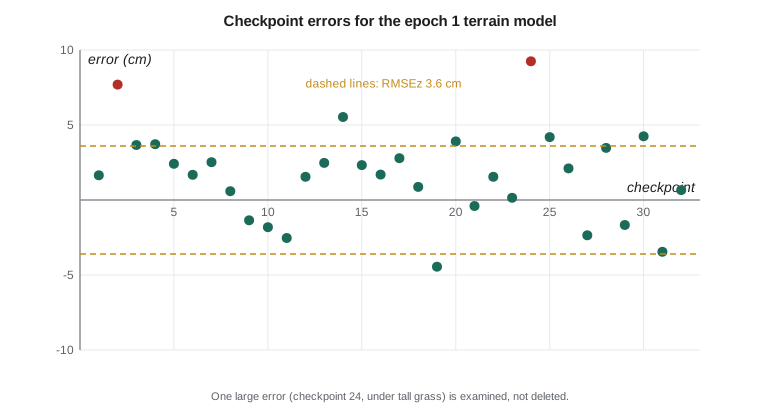
For epoch 1, the terrain model's product RMSEz is 3.4 cm and, including the 1.2 cm checkpoint survey error, the reported vertical accuracy is 3.6 cm. It meets the 5 cm vertical accuracy class required by R3 and the 3.6 cm working target for change detection, just. The horizontal RMSEh of the orthomosaic is 2.7 cm, meeting the 4 cm class of R2. The epoch 2 terrain model, tested on 31 of the original checkpoints plus its replacement, gives 3.4 cm.
Bias, outliers and what not to delete
The mean vertical error is +1.6 cm: the terrain model sits slightly above the checkpoints on average. A bias of this size is common in photogrammetric terrain models over grass, because the matching finds the top of short vegetation and the ground filter does not remove all of it. Nadia reports the mean beside the RMSE, as the standard expects, so that users know the error is not purely random. She does not subtract it from the model: a correction based on these checkpoints would remove their independence, and the bias may vary across the site.
The largest error is +9.2 cm at checkpoint 24. Nadia looks it up in the field log: it is on the upper slope in a patch of tall grass that was not flattened. It is a valid measurement of how the product behaves in tall grass. Deleting it would make the numbers look better and the report less honest. Instead, the team reports the result with and without vegetated checkpoints in separate categories, as Edition 2 allows for vegetated vertical accuracy, and notes that change detection in tall grass on the upper slope is less reliable than on open ground. Removing an outlier is justified only when there is evidence of a blunder, such as a target that was moved or misidentified, and the reason must be documented.
The error budget
An error budget predicts a product's accuracy from its components and shows which component matters most. The team's budget for the terrain model lists four independent sources: the control network, image matching, georeferencing of the block, and ground filtering. Because independent errors add in quadrature, the predicted total is the square root of the sum of their squares, about 2.8 cm. Image matching accounts for about 40 percent of the variance and ground filtering for about 30 percent.
The tested value of 3.4 cm for the product alone is a little worse than the predicted 2.8 cm. The difference is consistent with the vegetation effect seen at checkpoint 24 and in the bias. The budget therefore tells the team where to improve next time: better ground filtering on the upper slope, or terrestrial scans there too. Improving the control network further would do almost nothing, because it is already a small share of the error.
Worked problem
Combining errors in quadrature
A lidar terrain model has a control error of 1.5 cm, a sensor ranging error of 2.0 cm and a classification error of 2.5 cm, all independent. What total RMSE is expected, and what if the classification error is halved?
Show solution
- \[\sigma = \sqrt{1.5^2 + 2.0^2 + 2.5^2} = \sqrt{2.25 + 4.00 + 6.25} = 3.5 \text{ cm}\]
- \[\sigma' = \sqrt{1.5^2 + 2.0^2 + 1.25^2} = \sqrt{7.81} = 2.8 \text{ cm}\]
Answer: The expected total is 3.5 cm. Halving the largest component reduces it to 2.8 cm, while halving the smallest would barely change it. Effort should go to the largest term.
Testing the change detection itself
Requirement R4 is about change, not just about each epoch. The team tests it in two ways. First, on the stable areas described in lesson 7, the difference between epochs should be within the level of detection almost everywhere. About 96 percent of stable-area cells fall within plus or minus 9.7 cm, close to the 95 percent expected if the errors behave as assumed. Second, the terrestrial scans of the toe give an independent measure of change in the erosion area. The volume of loss from the scans agrees with the volume from the drone models within 12 percent, and the location of the scour matches.
These two tests together let the report make a defensible statement: change larger than about 10 cm on open ground can be detected at 95 percent confidence; in tall vegetation on the upper slope, the threshold is larger and the result is less reliable.
Testing the targets and the control
The slope target precisions come from the adjustment, but they are also tested. In each epoch, two targets were measured from both set-up marks independently. The differences between those independent determinations are 2 to 5 mm, consistent with the 4 mm per axis assumed in the movement test. For the control network, the repeat sessions on different days agree within 4 mm horizontally and 9 mm vertically, and the leveling agrees with the GNSS heights within 6 mm, as reported in lesson 6. Requirement R1 is met.
| Requirement | Test | Result | Met? |
|---|---|---|---|
| R1 control | Repeat sessions, leveling check | 4 mm horizontal, 9 mm vertical agreement | Yes |
| R2 orthomosaic | 32 checkpoints, horizontal | RMSEH 2.7 cm against 4 cm class | Yes |
| R3 terrain model | 32 checkpoints, vertical, open ground | RMSEV 3.6 cm (epoch 1), 3.4 cm (epoch 2) against 5 cm class | Yes |
| R4 change detection | Stable areas, scan comparison | 96 % of stable cells within LoD; volumes within 12 % | Yes, open ground |
| R5 slope targets | Independent repeat determinations | 2 to 5 mm differences | Yes |
Independent review
Before the results go to the clients, Leah reviews the quality report as the mentor, and Ruth reviews the parts that touch the control network and the datum. Their review finds one issue: the orthomosaic shows a slight smear along one flight line where a shadow moved between the nadir and oblique passes. It does not affect the accuracy test but could confuse a viewer, so Sofia rebuilds that part of the mosaic from the nadir images only. The review also asks the team to state the checkpoint survey accuracy explicitly in the accuracy statement, which it does.
The value of the review is not that the reviewers are smarter than the team. It is that they did not make the products, so they do not share the team's assumptions. That is why professional practice in both countries expects work to be checked by someone other than its author before it is relied on, and why the capstone builds review into the schedule.
Writing the accuracy statements
Each product gets a formal accuracy statement in the form recommended by the standard: the product, the accuracy class, the tested value and the number and type of checkpoints. For example: 'This terrain model was tested to meet a 5 cm vertical accuracy class in non-vegetated terrain. Tested RMSEV is 3.6 cm, including checkpoint survey error, based on 32 independent checkpoints. Vegetated terrain was tested separately and is reported for information.' Lesson 11 shows how these statements go into the metadata and the report.
Quality records
Every test in this lesson leaves a record: the checkpoint list with coordinates and survey method, the extracted model values, the computed errors, the summary statistics and the reviewer's sign-off. Nadia keeps these in a quality folder beside the products, with a short index that says which requirement each record supports. If a client, an auditor or next year's monitoring team asks how the team knows the terrain model meets its class, the answer is not a recollection but a file that anyone can open and recompute. In professional practice the same folder would form part of the firm's quality management records, and many firms are audited against them.
The records also capture what did not go well. The first checkpoint extraction used the wrong raster, the epoch 2 model, for two checkpoints, and the error was caught only because the reviewer recomputed three values by hand. The correction is recorded with its date and reason, in the same way as a correction in a field log. Mistakes found and fixed are evidence that the quality system works, not something to hide.
Common mistakes
MistakeTesting a product with the same points used to control it.
InsteadUse independent checkpoints kept out of all processing.
MistakeDeleting the largest checkpoint error to pass the class.
InsteadRemove an outlier only with evidence of a blunder; otherwise report it and explain it.
MistakeSubtracting the mean bias from the model using the checkpoints.
InsteadReport the bias; correcting with the checkpoints removes their independence.
MistakeImproving the smallest error component.
InsteadUse the error budget to target the largest component.
Summary and key terms
- Quality control tests products; quality assurance is the system that makes good products likely.
- Independent checkpoints test the final products; Edition 2 includes checkpoint error in the reported RMSE.
- Report bias and outliers honestly; remove points only with evidence of a blunder.
- An error budget adds independent components in quadrature and shows where effort should go.
- Change detection is tested on stable areas and against independent measurements.
- Independent review and formal accuracy statements complete the quality assessment.
- Quality control
- Checks and tests of data and products to find errors.
- Quality assurance
- The planned system of procedures, training and review that makes quality results likely.
- Bias
- The mean of the errors; a systematic offset of a product from the truth.
- Outlier
- An error much larger than the rest; it may be a blunder or a valid extreme.
- Error budget
- A list of independent error sources and their combined effect on a product.
- Accuracy statement
- A formal statement of the class, tested value and checkpoints for a product.
Practice problems
Work each problem on paper first, then reveal the answer to check.
Product RMSEz is 2.6 cm and checkpoint survey error is 1.5 cm. What RMSEV is reported?
Show answer
√(2.6² + 1.5²) = 3.0 cm.
RMSEx = 2.0 cm and RMSEy = 2.2 cm. What is RMSEH?
Show answer
√(2.0² + 2.2²) = 3.0 cm.
Why is the +1.6 cm mean error not subtracted from the model?
Show answer
Using the checkpoints to correct the model would destroy their independence, and the bias may vary across the site.
When may a checkpoint be removed from the test?
Show answer
Only when there is documented evidence of a blunder, such as a disturbed or misidentified target.
About what share of stable cells should fall within a 95 percent level of detection?
Show answer
About 95 percent.
Why does improving the control network barely improve this terrain model?
Show answer
Control is a small share of the error budget; matching and filtering dominate.
Lesson quiz · 5 questions
Score 60% or more to complete this lesson.
Create a free account to save your progress, take quizzes and earn a certificate.