
ENCM-100 · Lesson 8 of 12 · 25 min
Data analysis with pandas and Matplotlib
NumPy arrays (Lesson 7) are ideal for grids of numbers of one type. Much engineering data is tabular in a richer way: each row a test specimen, a meter reading or a piece of equipment, and each column a different kind of value, some numbers, some text, some dates. The pandas library handles such tables, with labeled columns, mixed types, powerful grouping and summarizing, and built-in support for time series. Matplotlib turns the results into plots that people can understand. This lesson covers the DataFrame and Series, selecting and filtering, computed columns, grouping and summarizing, time series with resampling and rolling averages, missing data, and the principles and mechanics of making clear, honest plots. Together with NumPy, these tools let an engineer go from a raw export to a defensible conclusion in a few dozen lines.
DataFrames and Series
A pandas DataFrame is a table with labeled columns and an index labeling the rows. Each column is a Series, a one-dimensional labeled array, and columns can hold different types. DataFrames are usually created by reading a file, such as pd.read_csv("tests.csv"), pd.read_excel(...) or pd.read_json(...), or from a dictionary of lists, as in the example below. A few attributes and methods describe a new DataFrame quickly: .shape (rows and columns), .head() and .tail() (the first and last rows), .dtypes (the type of each column), .info() (types and missing values) and .describe() (summary statistics of numeric columns). Always look at a new dataset this way before analyzing it (Lesson 5).
Selecting, filtering and computing
df["col"] selects one column as a Series; df[["a", "b"]] selects several as a DataFrame. Rows are selected with a boolean mask, exactly as in NumPy: df[df["age_days"] == 28]. Masks combine with & and |, with each condition in parentheses. The .loc[rows, cols] indexer selects by labels and .iloc[rows, cols] by positions.
New columns are computed with whole-column arithmetic, which is vectorized: df["strength_MPa"] = df["load_kN"] * 1000 / area. Avoid looping over rows; it is slow and rarely necessary.
import math
import pandas as pd

tests = pd.DataFrame({
    "specimen": ["A1", "A2", "A3", "B1", "B2", "B3", "C1", "C2", "C3"],
    "mix":      ["A", "A", "A", "B", "B", "B", "C", "C", "C"],
    "age_days": [7, 28, 28, 7, 28, 28, 7, 28, 28],
    "load_kN":  [301, 482, 495, 265, 431, 446, 352, 571, 548],
})
area_mm2 = math.pi * 100 ** 2 / 4               # 100 mm diameter cylinders
tests["strength_MPa"] = tests["load_kN"] * 1000 / area_mm2     # new column, vectorized
print(tests.round(1).head(3))
print(tests["strength_MPa"].describe().round(1))
at28 = tests[tests["age_days"] == 28]             # filter rows
summary = at28.groupby("mix")["strength_MPa"].agg(["mean", "min", "count"]).round(1)
print(summary)
print("Mixes averaging at least 60 MPa at 28 days:", list(summary.index[summary["mean"] >= 60])) specimen mix age_days load_kN strength_MPa
0 A1 A 7 301 38.3
1 A2 A 28 482 61.4
2 A3 A 28 495 63.0
count 9.0
mean 55.0
std 13.6
min 33.7
25% 44.8
50% 56.8
75% 63.0
max 72.7
Name: strength_MPa, dtype: float64
mean min count
mix
A 62.2 61.4 2
B 55.8 54.9 2
C 71.2 69.8 2
Mixes averaging at least 60 MPa at 28 days: ['A', 'C']Grouping and summarizing
The groupby method splits a table into groups by the values of one or more columns, applies a calculation to each group, and combines the results: "split, apply, combine". In the example, at28.groupby("mix")["strength_MPa"].agg(["mean", "min", "count"]) gives, for each concrete mix, the mean and lowest 28-day strength and the number of specimens, in one line. The same pattern answers many engineering questions: mean energy use by building and month, failure counts by equipment type, average travel time by route and hour.
Worked problem
Is the mix acceptable?
The specification calls for a specified strength of 55 MPa. Using the grouped results, which mixes look acceptable, and what further information does a real acceptance decision need?
Show solution
- Mixes A and C average 62.2 and 71.2 MPa with no individual test below 61 MPa; mix B averages 55.8 MPa, barely above the specified value, with one test at 54.9 MPa.
- Concrete standards judge acceptance by rules on running averages of several consecutive tests and on individual low results, not on the mean alone, and require many more tests than two per mix.
- The mix design itself must target a strength well above the specified value, by a margin that depends on the variability of the producer's results.
Answer: A and C look comfortably acceptable; B is marginal and would likely fail a proper acceptance rule as its results accumulate. The code makes the comparison easy; the engineering judgment comes from the standard's rules and an understanding of variability, and the program should implement those rules exactly (CSA A23.1 in Canada; ACI 318 in the United States).
Time series
Data indexed by time, such as meter readings, sensor logs, flows, temperatures and traffic counts, is where pandas excels. With a DatetimeIndex, a Series can be:
- Resampled to a different frequency: s.resample("D").sum() totals hourly kW into daily kWh, .mean() averages, .max() finds daily peaks.
- Smoothed with rolling windows: s.rolling(24).mean() is a 24-hour moving average.
- Filtered by time features: s[s.index.hour < 5] selects night hours; .dayofweek separates weekdays from weekends.
- Sliced by date: s["2026-01-12":"2026-01-18"] selects one week.
import numpy as np
import pandas as pd

t = pd.date_range("2026-01-05", periods=28 * 24, freq="h")        # four weeks, hourly
hour, dow = t.hour.to_numpy(), t.dayofweek.to_numpy()
occupied = (dow < 5) & (hour >= 7) & (hour < 19)                    # weekday working hours
rng = np.random.default_rng(42)
kW = 40 + 85 * occupied + 6 * rng.standard_normal(len(t))          # building electrical demand
s = pd.Series(kW, index=t, name="kW")

daily = s.resample("D").sum()                                       # kWh per day
print(daily.head(7).round(0))
print("Weekday mean:", round(daily[daily.index.dayofweek < 5].mean()), "kWh;",
      "weekend mean:", round(daily[daily.index.dayofweek >= 5].mean()), "kWh")
print("Peak demand:", round(s.max(), 1), "kW at", s.idxmax())
print("Night base load (0-5 h):", round(s[s.index.hour < 5].mean(), 1), "kW")
smooth = s.rolling(24).mean()                                       # 24-hour moving average
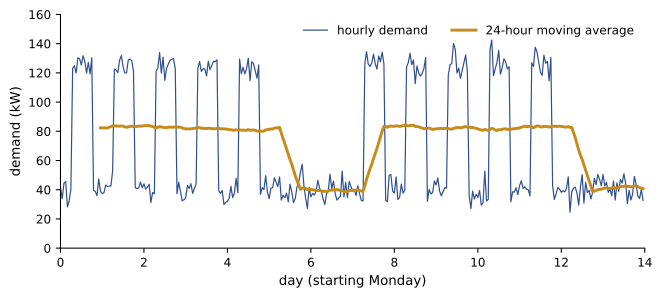
print("Highest 24-h average:", round(smooth.max(), 1), "kW")2026-01-05 1977.0 2026-01-06 2006.0 2026-01-07 1967.0 2026-01-08 1957.0 2026-01-09 1950.0 2026-01-10 963.0 2026-01-11 947.0 Freq: D, Name: kW, dtype: float64 Weekday mean: 1975 kWh; weekend mean: 955 kWh Peak demand: 142.4 kW at 2026-01-15 08:00:00 Night base load (0-5 h): 39.8 kW Highest 24-h average: 84.6 kW
In a few lines, the analysis reveals the building's energy signature: about 1,975 kWh on weekdays and 955 kWh on weekends, a peak of 142 kW during working hours, and a base load of about 40 kW running all night and all weekend. That base load, nearly half the weekend energy, is often the first target in an energy audit: equipment, lighting and ventilation that run when nobody is there. The peak matters because many utilities charge large commercial customers for their highest demand in each billing period as well as for energy.
Missing data
Real tables have gaps. Pandas represents missing values as NaN (not a number) or NaT for times, and most calculations skip them by default: .mean() ignores NaN. That convenience can hide problems, so always count missing values first with df.isna().sum(). Then decide, by a rule stated in advance (Lesson 6), whether to drop rows (.dropna()), fill with a constant (.fillna(0)), carry the last value forward (.ffill()), or interpolate (.interpolate()). For sensor data, short gaps can often be interpolated; long gaps should be flagged rather than invented.
Making plots with Matplotlib
Matplotlib's object-oriented interface gives full control: fig, ax = plt.subplots() creates a figure and a set of axes; ax.plot, ax.scatter, ax.bar and ax.hist draw data; ax.set_xlabel, ax.set_ylabel, ax.set_title and ax.legend add labels; and fig.savefig("name.png", dpi=150) writes a file for a report. Several panels share a figure with plt.subplots(rows, cols). Pandas objects have a .plot() method that calls Matplotlib with sensible defaults, convenient for quick exploration.
import numpy as np
import matplotlib
matplotlib.use("Agg")                          # draw to a file, no window
import matplotlib.pyplot as plt

load = np.array([0, 5, 10, 15, 20, 25, 30])                       # kN
ext = np.array([0.000, 0.045, 0.089, 0.131, 0.178, 0.221, 0.264])  # mm
slope, icpt = np.polyfit(load, ext, 1)
resid = ext - (slope * load + icpt)

fig, (ax1, ax2) = plt.subplots(2, 1, figsize=(6, 6), sharex=True)
ax1.plot(load, ext, "o", label="measured")
ax1.plot(load, slope * load + icpt, "-", label=f"fit: {slope * 1000:.2f} um/kN")
ax1.set_ylabel("Extension (mm)")
ax1.set_title("Tensile test, 12 mm bar, 200 mm gauge length")
ax1.legend()
ax1.grid(alpha=0.3)
ax2.axhline(0, color="gray", lw=0.8)
ax2.plot(load, resid * 1000, "s")
ax2.set_xlabel("Load (kN)")
ax2.set_ylabel("Residual (um)")
fig.tight_layout()
fig.savefig("tensile.png", dpi=150)
print(f"Saved tensile.png; slope {slope * 1000:.2f} um/kN; largest residual {abs(resid).max() * 1000:.1f} um")Saved tensile.png; slope 8.81 um/kN; largest residual 1.6 um
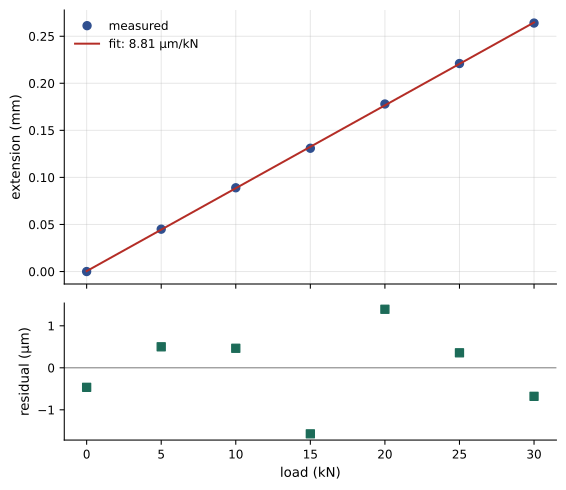
The residual panel is worth the extra lines. Residuals, the differences between data and fit, should scatter randomly around zero; a curved or trending pattern means the model is wrong (for example, a tensile test continued past the elastic limit), and a single large residual flags a possible bad reading. Here they are small and patternless, so the straight-line fit and the modulus calculated from it (Lesson 5) are trustworthy.
Plotting principles
The principles of ENGG-160 apply to every plot an engineer makes: choose the chart type to suit the message (line for trends over time, scatter for relationships, bars for comparisons, histograms for distributions); label axes with quantities and units; start bar charts at zero; avoid clutter; and make the main point visible, with an annotation if needed. A few Matplotlib-specific habits help:
- Use markers without lines for discrete measurements, and lines for continuous models or dense time series.
- Set figure sizes and font sizes for the final medium: a slide needs larger text than a report.
- Save as a vector format (SVG or PDF) for reports when possible, so lines stay sharp at any size, or as PNG at 150 to 300 dpi.
- Use a color-blind-friendly palette and distinguish series by marker or line style as well as color.
- Script every figure. A figure produced by code can be regenerated in seconds when data change or a reviewer asks for a different scale; a figure adjusted by hand cannot.
A reproducible analysis workflow
For any analysis that will support a decision, keep the raw data unchanged, do all cleaning and analysis in a script or notebook that runs from start to finish, and save outputs (tables and figures) from that script. Record the versions of key libraries and any assumptions or rules applied to the data. Then anyone, including you six months later, can rerun the analysis, check it and extend it. Lesson 12 returns to these practices.
Common mistakes
MistakeLooping over DataFrame rows to compute a column.
InsteadUse vectorized column arithmetic.
MistakeAnalyzing without checking dtypes and missing values.
InsteadUse .info(), .describe() and .isna().sum() first.
MistakeLetting .mean() silently skip many missing values.
InsteadCount gaps and apply a stated rule.
MistakePlotting a fit without looking at residuals.
InsteadCheck residuals for patterns and outliers.
MistakeEditing figures by hand for a report.
InsteadScript every figure so it can be regenerated.
Summary and key terms
- A DataFrame is a table of labeled columns (Series) that can hold different types.
- Inspect new data with shape, head, dtypes, info and describe.
- Select columns by name, rows by boolean masks; compute new columns with vectorized arithmetic.
- groupby splits, applies and combines to summarize by category.
- Time series support resampling, rolling windows and selection by date and time features.
- Count and deliberately handle missing values.
- Matplotlib's subplots, labeled axes and savefig produce clear, reproducible figures; check residuals.
- DataFrame
- A pandas table with labeled rows and columns.
- Series
- A one-dimensional labeled array, one column of a DataFrame.
- Index
- The labels of a DataFrame's rows.
- groupby
- Splitting data into groups, applying a calculation and combining results.
- Resampling
- Changing a time series to a different frequency.
- Rolling window
- A moving calculation over a fixed number of consecutive values.
- NaN
- The marker for a missing or undefined numeric value.
- Residual
- The difference between an observed value and a fitted model.
- Base load
- The minimum continuous demand of a building or system.
- Reproducible analysis
- An analysis that can be rerun from raw data to identical results.
Practice problems
Work each problem on paper first, then reveal the answer to check.
How do you see the column types and missing-value counts of a DataFrame df?
Show answer
df.info() and df.isna().sum().
Select the rows of df where "mix" is "B" and "age_days" is 28.
Show answer
df[(df["mix"] == "B") & (df["age_days"] == 28)].
Add a column for stress in kPa from a column in MPa.
Show answer
df["stress_kPa"] = df["stress_MPa"] * 1000.
Write a line giving mean energy by building from columns "building" and "kWh".
Show answer
df.groupby("building")["kWh"].mean().
Convert a 15-minute kW series s to hourly averages.
Show answer
s.resample("h").mean().
From the demand example, about what share of weekend energy is base load?
Show answer
Essentially all of it: weekends have no occupied hours, and 40 kW × 24 h ≈ 960 kWh matches the 955 kWh weekend mean.
Why might a utility bill depend on peak demand?
Show answer
Generation and network capacity must be built for the highest demand.
Name two ways to fill a short gap in sensor data.
Show answer
Interpolation or carrying the last value forward.
What does a curved pattern in residuals tell you?
Show answer
The fitted model has the wrong form.
Why save report figures as SVG or PDF where possible?
Show answer
Vector formats stay sharp at any size.
Lesson quiz · 5 questions
Score 60% or more to complete this lesson.
Create a free account to save your progress, take quizzes and earn a certificate.