
ENCM-100 · Lesson 7 of 12 · 25 min
NumPy in depth: arrays, broadcasting and linear algebra
Lesson 5 introduced NumPy arrays and whole-array arithmetic. Most engineering data, though, is not a single list of numbers: it is a table of readings from several sensors over time, a grid of temperatures over a plate, a matrix of stiffnesses, a set of design options evaluated under several load cases. NumPy's real power lies in multidimensional arrays and the rules that let operations combine arrays of different shapes without writing loops. This lesson covers array shapes and creation, indexing and slicing in two dimensions, boolean masks, broadcasting, aggregation along an axis, and the linear algebra routines that solve systems of equations and eigenvalue problems, with examples from strain gauges, beam selection, building energy and structural vibration.
Shapes and dimensions
Every NumPy array has a shape, a tuple giving its size along each dimension (axis). A list of 10 readings has shape (10,); a table of 3 gauges by 5 load steps has shape (3, 5); a temperature field on a 50 × 80 grid recorded at 100 times has shape (100, 50, 80). Arrays hold a single data type (dtype), usually 64-bit floats or integers, which is what makes them compact and fast.
Common ways to create arrays:
- np.array(list) from Python lists (nested lists for 2D).
- np.zeros((3, 5)), np.ones(...), np.full(shape, value) for arrays of a fixed value.
- np.arange(start, stop, step) for evenly spaced values by step, and np.linspace(a, b, n) for n evenly spaced values including both ends.
- np.eye(n) for an identity matrix, np.diag(v) for a diagonal matrix.
- np.loadtxt and np.genfromtxt to read numeric text files directly into arrays.
The reshape method changes the shape without changing the data (the total size must stay the same), .T transposes a 2D array, and .flatten() makes a 1D copy.
Indexing and slicing in two dimensions
For a 2D array A, A[i, j] is the element in row i and column j (counting from zero). Slices work on each axis: A[:, 2] is the whole of column 2, A[1, :] or simply A[1] is row 1, and A[0:2, 1:4] is a block. Negative indices count from the end. A slice of an array is a view of the same data, not a copy, so changing it changes the original; use .copy() when you need an independent array.
import numpy as np

# Strain readings: 3 gauges (rows) at 5 load steps (columns), microstrain
S = np.array([[ 0, 210, 405, 618, 822],
              [ 0, 198, 401, 597, 805],
              [ 0, 230, 455, 690, 931]])
print(S.shape, S.ndim, S.size, S.dtype)
print(S[1, 3])            # gauge 2, load step 4
print(S[:, -1])           # every gauge at the last step
print(S[2, 1:4])          # gauge 3, steps 2 to 4
high = S > 800
print(high.sum(), "readings above 800")
print(np.where(S > 800, "HIGH", "ok"))
print(S.T.shape, S.reshape(5, 3).shape, S.flatten()[:6])(3, 5) 2 15 int64 597 [822 805 931] [230 455 690] 3 readings above 800 [['ok' 'ok' 'ok' 'ok' 'HIGH'] ['ok' 'ok' 'ok' 'ok' 'HIGH'] ['ok' 'ok' 'ok' 'ok' 'HIGH']] (5, 3) (5, 3) [ 0 210 405 618 822 0]
A comparison such as S > 800 produces a boolean array of the same shape, a mask. Masks select elements (S[S > 800]), count them (mask.sum(), since True counts as 1), and combine with & (and), | (or) and ~ (not); note that each condition must be in parentheses, as in (S > 200) & (S < 600). The function np.where(condition, a, b) builds a new array taking a where the condition is true and b where it is false, a vectorized if-else.
Broadcasting
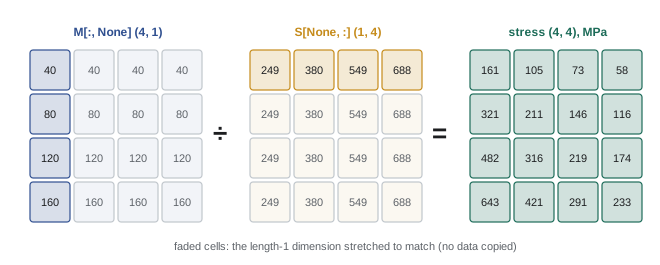
Arithmetic between arrays of different shapes follows the broadcasting rules: NumPy compares shapes from the last dimension backward, and two dimensions are compatible if they are equal or one of them is 1. A dimension of length 1 is stretched (without copying data) to match the other. So an array of shape (4, 1) combined with one of shape (1, 4) produces a (4, 4) result: every element of the first paired with every element of the second.
Broadcasting replaces nested loops with a single expression. Adding None as an index (or using reshape) inserts a dimension of length 1: M[:, None] turns a 1D array of 4 moments into a column of shape (4, 1).
import numpy as np

M = np.array([40, 80, 120, 160])                  # factored moments, kN m
names = ["W200x27", "W250x33", "W310x39", "W360x45"]
S = np.array([249, 380, 549, 688]) * 1e3          # section moduli, mm3
Fy, phi = 345.0, 0.9                              # yield stress MPa, resistance factor

# Broadcasting: a column of moments against a row of sections gives a 4 x 4 table
stress = (M[:, None] * 1e6) / S[None, :]          # MPa
ok = stress <= phi * Fy
print(np.round(stress).astype(int))
for i, m in enumerate(M):
    j = np.argmax(ok[i])                          # first True: lightest adequate section
    choice = names[j] if ok[i].any() else "none"
print(f"M = {m:3d} kN m: lightest section {choice}")[[161 105 73 58] [321 211 146 116] [482 316 219 174] [643 421 291 233]] M = 40 kN m: lightest section W200x27 M = 80 kN m: lightest section W250x33 M = 120 kN m: lightest section W310x39 M = 160 kN m: lightest section W310x39
The 4 × 4 table of stresses comes from one line, M[:, None] / S[None, :], replacing two nested loops. Comparing it with the factored resistance φF_y gives a boolean table, and np.argmax on each row finds the first True, the lightest section that works, because the sections are listed in order of weight. A beam with a factored moment of 160 kN·m needs at least a W310×39 under these simplified assumptions (ENGG-130, Lesson 11, shows where the section modulus comes from). Real member selection also checks shear, deflection and lateral-torsional buckling.
Aggregating along an axis
Functions such as sum, mean, max, min, std and argmax reduce an array to fewer numbers. With no argument they reduce the whole array; with axis=0 they reduce down the rows, giving one result per column, and with axis=1 across the columns, giving one result per row. Remembering which is which is easier if you think of the axis as the one that disappears: a (7, 24) table reduced along axis=1 gives 7 values.
import numpy as np

days, hours = 7, 24
h = np.arange(hours)
day_mean = np.array([-4.0, -2.5, 1.0, 3.5, 2.0, -1.0, -6.0])      # daily mean temperature, C
swing = np.array([5.0, 6.0, 4.0, 7.0, 3.0, 5.5, 8.0])            # half the daily range, C
# 7 x 24 table: each row a day; broadcasting combines the day columns with the hour row
T = day_mean[:, None] + swing[:, None] * np.sin(2 * np.pi * (h[None, :] - 9) / 24)
print(T.shape)
print("Daily max:", np.round(T.max(axis=1), 1))
print("Daily min:", np.round(T.min(axis=1), 1))
print("Hourly mean over the week (first 6 h):", np.round(T.mean(axis=0)[:6], 1))
hdd = np.clip(18 - T, 0, None).sum() / 24        # heating degree-days from hourly data
print(f"Heating degree-days this week: {hdd:.1f}")
print("Hours below freezing:", int((T < 0).sum()), "of", T.size)(7, 24) Daily max: [ 1. 3.5 5. 10.5 5. 4.5 2. ] Daily min: [ -9. -8.5 -3. -3.5 -1. -6.5 -14. ] Hourly mean over the week (first 6 h): [-4.9 -5.8 -6.3 -6.5 -6.3 -5.8] Heating degree-days this week: 133.0 Hours below freezing: 91 of 168
The example builds a whole week of hourly temperatures from two short arrays by broadcasting, then summarizes it per day (axis=1) and per hour of the day (axis=0). Heating degree-days, a standard measure of heating demand used to estimate building energy use, are computed in one line with np.clip, which replaces values below zero by zero, so that only the hours colder than 18 °C count. Each operation that would need a loop over 168 values in plain Python is a single expression in NumPy.
Worked problem
Vectorizing a loop
A plain Python loop computes the power from 100,000 pairs of voltage and current readings: p = [] then for v, i in zip(V, I): p.append(v * i). How do you do it in NumPy, and why is it better?
Show solution
- Convert the readings to arrays V and I (or read them directly as arrays).
- Compute P = V * I: one element-wise multiplication.
- Aggregate: P.mean(), P.max(), and energy by np.trapezoid(P, t) if times t are known.
Answer: P = V * I. It is shorter, reads like the formula, and runs typically 50 to 100 times faster, because the loop happens inside compiled code instead of the Python interpreter. For large datasets, such as a year of one-second readings (31.5 million values), the difference is between a fraction of a second and several minutes.
Linear algebra
Many engineering problems lead to systems of linear equations Ax = b: mesh and nodal analysis of circuits (PHYS-131), forces in statically determinate trusses (ENGG-130), heat conduction on a grid, and the stiffness equations of structural analysis. Lesson 5 used np.linalg.solve for a small system. The same function solves systems with thousands of unknowns, using LU factorization (MATH-125), and you should use it rather than computing an inverse: np.linalg.inv(A) @ b is slower and less accurate.
The @ operator performs matrix multiplication (A @ B), while * multiplies element by element. Other useful routines include np.linalg.det (determinant), np.linalg.norm (vector and matrix norms), np.linalg.cond (condition number, which warns when a system is nearly singular and its solution sensitive to small errors), and np.linalg.eig and eigh for eigenvalues and eigenvectors.
import numpy as np

# Two-level frame: floor masses (kg) and level stiffnesses (N/m)
m1, m2 = 20000.0, 15000.0
k1, k2 = 4.0e7, 3.0e7
M = np.diag([m1, m2])
K = np.array([[k1 + k2, -k2],
              [-k2,      k2]])
# Natural frequencies: symmetric form A = M^(-1/2) K M^(-1/2), solved with eigh
Mh = np.diag(1 / np.sqrt(np.diag(M)))
w2, phi = np.linalg.eigh(Mh @ K @ Mh)             # eigenvalues in ascending order
modes = Mh @ phi
f = np.sqrt(w2) / (2 * np.pi)
print("Natural frequencies (Hz):", np.round(f, 2))
for i in range(2):
    v = modes[:, i] / modes[np.argmax(np.abs(modes[:, i])), i]
    print(f"Mode {i + 1} shape (floor 1, floor 2):", np.round(v, 3))

# Static check: lateral loads of 50 and 80 kN at the two floors
F = np.array([50e3, 80e3])
x = np.linalg.solve(K, F)
print("Floor displacements (mm):", np.round(x * 1000, 2))Natural frequencies (Hz): [ 4.67 10.84] Mode 1 shape (floor 1, floor 2): [0.569 1. ] Mode 2 shape (floor 1, floor 2): [ 1. -0.758] Floor displacements (mm): [3.25 5.92]
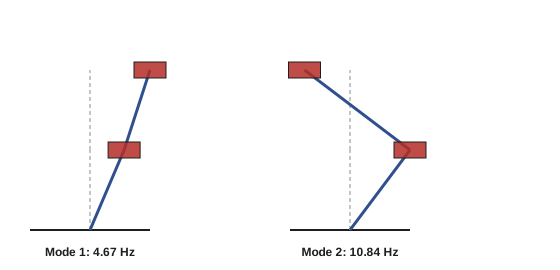
The two-story frame is modeled with floor masses and story stiffnesses. Its natural frequencies come from the eigenvalue problem Kφ = ω²Mφ: the first mode, at 4.67 Hz, has both floors moving the same way, the upper one more; the second, at 10.84 Hz, has them moving in opposite directions. Transforming to a symmetric matrix and using eigh guarantees real eigenvalues returned in ascending order. Engineers compare such frequencies with those of earthquakes, wind gusts, footfall or machinery to avoid resonance (PHYS-130). The static solve gives the floor displacements under lateral loads, 3.25 and 5.92 mm. Structural analysis programs solve exactly these equations, with thousands of degrees of freedom.
Random numbers
np.random.default_rng(seed) creates a random number generator; rng.normal(mean, sd, size), rng.uniform(a, b, size) and rng.integers(...) draw arrays of random values. Fixing the seed makes results reproducible, which is essential when a simulation is part of a report. Lesson 11 uses random arrays for Monte Carlo simulation of uncertain loads and reliability.
Performance habits
A few habits make NumPy code fast and correct:
- Avoid Python loops over array elements; look for a vectorized expression, a ufunc (np.sqrt, np.exp, np.maximum) or an aggregate.
- Preallocate arrays with np.zeros if you must fill them in a loop, rather than appending to a list and converting.
- Watch dtypes: integer arrays do integer arithmetic and can overflow silently for very large values; use floats for physical quantities.
- Check shapes with .shape whenever an operation surprises you; most NumPy bugs are shape mismatches that broadcasting quietly accepted.
- Remember that slices are views: modify a .copy() if the original must be preserved.
Common mistakes
MistakeMixing up axis=0 and axis=1.
InsteadThe named axis is the one that disappears in the result.
MistakeWriting S > 200 & S < 600.
InsteadParenthesize each comparison: (S > 200) & (S < 600).
MistakeUsing * for matrix multiplication.
InsteadUse @ for matrix products; * is element by element.
MistakeComputing inv(A) @ b to solve a system.
InsteadUse np.linalg.solve(A, b).
MistakeChanging a slice and expecting the original to stay the same.
InsteadSlices are views; use .copy().
Summary and key terms
- Arrays have a shape, number of dimensions and single dtype; create them with array, zeros, arange, linspace and eye.
- A[i, j], A[:, j] and A[i0:i1, j0:j1] index and slice 2D arrays; slices are views.
- Boolean masks select and count elements; np.where is a vectorized if-else.
- Broadcasting stretches length-1 dimensions to combine arrays of different shapes without loops.
- Aggregates with axis= summarize rows or columns.
- np.linalg.solve, eigh, cond and @ handle linear algebra; never invert to solve.
- Vectorized code is shorter, clearer and much faster than loops.
- Shape
- The size of an array along each axis.
- Axis
- One dimension of an array; axis 0 runs down rows, axis 1 across columns.
- dtype
- The single data type of an array's elements.
- View
- An array that shares data with another; changes affect both.
- Boolean mask
- An array of True and False values used to select elements.
- Broadcasting
- NumPy's rules for combining arrays of different shapes.
- Vectorization
- Replacing explicit loops with whole-array operations.
- ufunc
- A NumPy function that applies element by element to arrays.
- Eigenvalue problem
- Finding scalars λ and vectors v with Av = λv.
- Condition number
- A measure of how sensitive a linear system's solution is to errors.
Practice problems
Work each problem on paper first, then reveal the answer to check.
What is the shape of np.zeros((4, 6)).T?
Show answer
(6, 4).
How do you select column 3 of a 2D array A?
Show answer
A[:, 3].
Write a mask for values of A between 10 and 20 inclusive.
Show answer
(A >= 10) & (A <= 20).
What shape results from combining shapes (5, 1) and (3,)?
Show answer
(5, 3).
Why does combining shapes (5,) and (3,) fail?
Show answer
The last dimensions, 5 and 3, are neither equal nor 1.
A has shape (12, 31) for months by days. What does A.sum(axis=1) give?
Show answer
12 monthly totals.
In the beam example, which section is chosen for 100 kN·m?
Show answer
W250x33 gives 263 MPa ≤ 310.5 MPa, so W250x33.
How would you compute heating degree-days with a base of 15 °C instead?
Show answer
np.clip(15 − T, 0, None).sum()/24.
What does np.linalg.cond(A) warn you about?
Show answer
That A is nearly singular and the solution may be very sensitive to errors.
If the upper story stiffness doubled, would the first natural frequency rise or fall?
Show answer
Rise: a stiffer structure has higher natural frequencies.
Lesson quiz · 5 questions
Score 60% or more to complete this lesson.
Create a free account to save your progress, take quizzes and earn a certificate.