
ELE-499 · Lesson 4 of 12 · 20 min
System architecture and power budget
The trade study chose a concept; the architecture turns it into a definite system. In weeks seven and eight Leo led the team through the architecture: the major blocks, the interfaces between them, the voltages and power ratings at each interface, and the control and communication links that tie them together. The architecture is the skeleton every later lesson hangs on, so mistakes here are expensive. This lesson covers the block diagram, interface definitions, the power budget, the energy balance that sizes the battery, and the auxiliary loads that students often forget.
The block diagram
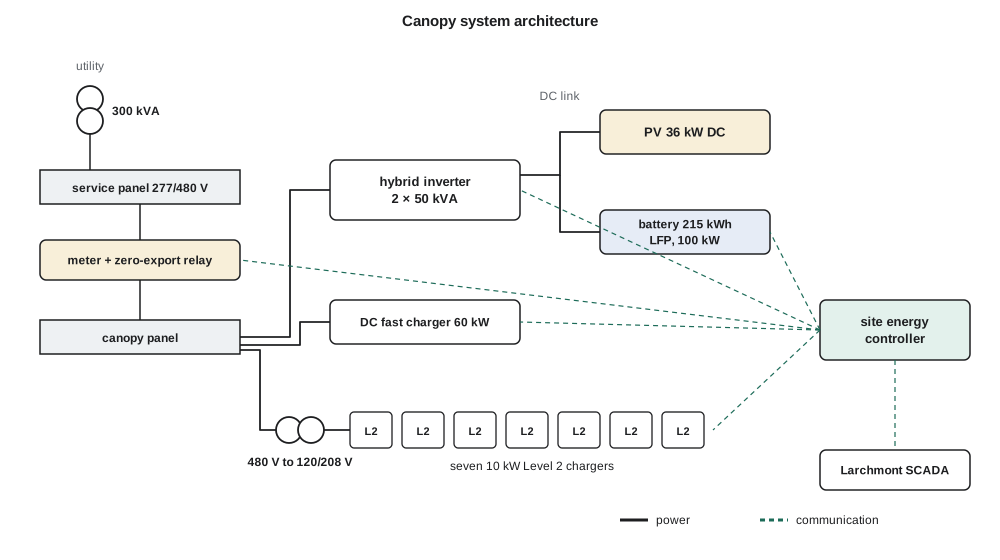
The yard's existing 300 kVA transformer supplies a 277/480 V three-phase service, a common commercial voltage in the United States. The canopy connects to it through a new breaker in the service panel, a revenue-grade meter and a zero-export relay. Behind that connection sit a 100 kVA hybrid inverter, built from two 50 kVA units in parallel, whose shared DC link joins a 36 kW DC solar array on the canopy roof and a 215 kWh lithium iron phosphate battery cabinet. A 60 kW direct-current fast charger connects to the 480 V panel directly. Seven 10 kW Level 2 chargers, one for each of the other vehicles, are supplied through a 480 V to 120/208 V step-down transformer.
Over everything sits the site energy controller (SEC), a small industrial computer and input/output board in its own enclosure. It reads the meter, the inverter, the battery management system and the chargers; it sets the inverter's power and the chargers' current limits; it enforces the grid limit and the storm reserve; and it reports to Larchmont's supervisory control and data acquisition (SCADA) system. Every concept needed a controller like this, and no commercial product did exactly what the client required, so it became the team's main design deliverable alongside the converter demonstrator.
Defining interfaces
An architecture is only as good as its interface definitions. For every connection between blocks, the team wrote down what crosses it and the limits that apply. Electrical interfaces list voltage, current, power, frequency, grounding, protection and connector or termination type. Communication interfaces list the protocol, the data exchanged, the update rate, who is master, and what happens if the link fails. Mechanical and thermal interfaces list mounting, cooling and environmental limits. These definitions went into an interface control document, the single place the four team members and the client could check to be sure their parts would fit together.
Writing the failure behavior for each communication link turned out to be the most useful part. What should a charger do if it stops hearing from the controller? If it keeps charging at its last setpoint, a failed controller could let the site exceed the grid limit. If it stops, a failed controller could leave a truck uncharged before a storm. The team specified a middle course: on loss of communication for more than 60 seconds, each charger falls back to a preset safe current that keeps the total within the limit with the battery offline. That decision appears again in lesson 7.
The power budget
A power budget lists, for each operating condition, every source and load and checks that they balance within the ratings. The worst case for the canopy is a winter night when every vehicle needs charging and the solar array produces nothing. The chargers' nameplate total is about 130 kW, the grid can supply 60 kW and the battery up to 100 kW. In principle the system could supply all chargers at once from grid and battery together, but only for about two hours before the battery reached its storm floor. The controller therefore has to manage charging so that the average demand over the night stays within what the grid can supply, using the battery to absorb the peaks.
| Condition | Sources | Loads | Margin |
|---|---|---|---|
| Winter night, all chargers at nameplate | grid 60 kW + battery 100 kW | chargers 130 kW + auxiliaries 3 kW | 27 kW, battery-limited in time |
| Winter night, managed charging | grid 60 kW | chargers 52–57 kW + auxiliaries 3 kW | 0–5 kW |
| Summer noon, midday top-up | PV 29 kW + grid 31 kW | fast charger 60 kW + auxiliaries 1 kW | battery 100 kW available |
| Storm outage, islanded | battery 100 kW + PV | two Level 2 chargers 20 kW + auxiliaries 3 kW | 77 kW |
The energy balance
Power ratings say whether the system can deliver a moment's demand; energy decides whether it can do so all night, every night. The team built an hour-by-hour energy balance for a design winter weekday and a summer weekday. It uses a simple solar model for the canopy's latitude, the fleet's charging profile from lesson 2, a time-of-use rule that discharges the battery in the daytime and evening and recharges it from the grid at night, a 70 % storm-season floor on the battery in winter, and the 60 kW grid cap throughout.
# Hourly energy balance for the canopy on a winter and a summer weekday (Madison)
import math
PV_KWDC, GRID_MAX, BATT_KWH, BATT_KW = 36.0, 60.0, 215.0, 100.0
LAT = 43.07
def pv(h, day, sky):
    dec = 23.45 * math.sin(math.radians(360 * (284 + day) / 365))
    ha = math.radians(15 * (h + 0.5 - 12)); la, de = math.radians(LAT), math.radians(dec)
    s = math.sin(la) * math.sin(de) + math.cos(la) * math.cos(de) * math.cos(ha)
    return 0.0 if s <= 0 else PV_KWDC * 0.80 * sky * s ** 1.15 * 1.05   # temperature, soiling, wiring, inverter
def fleet(h):                              # 363 kWh: smart charging overnight plus a noon top-up
    if h >= 17 or h < 6: return 363 * 0.90 / 13
    return 363 * 0.10 if h == 12 else 0.0
for name, day, sky, floor, target in (('winter', 15, 0.55, 0.70, 0.95), ('summer', 196, 0.85, 0.10, 0.35)):
    soc = 0.95
    for rep in range(3):                   # repeat the day until the start and end state agree
        peak = grid = pvsum = thru = 0.0
        for h in range(24):
            p, load = pv(h, day, sky), fleet(h)
            onpeak = 7 <= h < 23
            if p >= load:                  # surplus PV charges the battery; zero export spills the rest
                c = min(p - load, BATT_KW, (0.95 - soc) * BATT_KWH); soc += c * 0.95 / BATT_KWH; g = 0.0
            else:
                d = load - p
                b = min(d, BATT_KW, max(0.0, (soc - floor) * BATT_KWH * 0.95)) if onpeak else 0.0
                soc -= b / 0.95 / BATT_KWH; thru += b; g = d - b
                if not onpeak:             # off-peak: refill to the season's target, leaving room for tomorrow's PV
                    c = min(GRID_MAX - g, BATT_KW, max(0.0, (target - soc) * BATT_KWH)); g += c; soc += c * 0.95 / BATT_KWH
            assert g <= GRID_MAX + 1e-9
            peak = max(peak, g); grid += g; pvsum += p
    print(f"{name}: PV {pvsum:5.1f} kWh, grid {grid:5.1f} kWh, peak grid {peak:4.1f} kW, "
f"battery delivered {thru:5.1f} kWh, floor {floor*100:.0f} %, night target {target*100:.0f} %")winter: PV 36.0 kWh, grid 351.6 kWh, peak grid 60.0 kW, battery delivered 61.7 kWh, floor 70 %, night target 95 % summer: PV 207.4 kWh, grid 192.3 kWh, peak grid 43.7 kW, battery delivered 153.0 kWh, floor 10 %, night target 35 %
The winter result is the important one. On a January weekday in Madison the canopy produces about 36 kWh, the grid supplies about 352 kWh, and the battery cycles about 62 kWh while staying above its storm floor. Most significantly, grid import reaches exactly the 60 kW limit at 23:00, when the off-peak period begins and the controller refills the battery while the vehicles are still charging. Requirement R2 is met, but with no margin. That told the team that the controller's limit enforcement had to be accurate and fast, and that any additional load on the site, a second fast charger, say, would need either a larger battery, a service upgrade, or a client decision to accept slower charging. In summer the picture is relaxed: the array produces about 207 kWh, the battery cycles deeply, and peak import is about 44 kW.
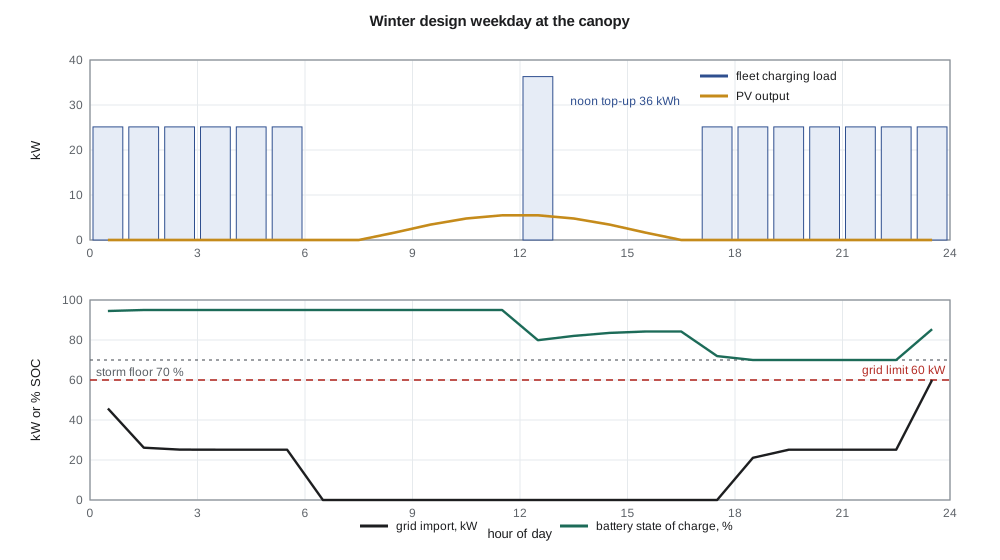
The model is simple, and the team said so in the report. It uses one representative day per season, a clear-sky solar shape scaled by a cloudiness factor rather than measured weather, and fixed efficiencies. Its purpose is to size the system and test the control strategy, not to predict annual energy to the kilowatt-hour. The team checked its solar output against published long-term averages for each city and found it within about 15 %, adequate for the decisions it supported.
Worked problem
Battery hours at full charger demand
With the grid supplying 60 kW and all chargers drawing 130 kW plus 3 kW of auxiliaries, the battery must supply the rest. How long can it do so from 95 % to the 70 % storm floor of a 215 kWh battery, with 95 % discharge efficiency?
Show solution
- Battery power: 130 + 3 − 60 = 73 kW.
- Energy available: 215 × (0.95 − 0.70) × 0.95 ≈ 51 kWh.
- \[t = \dfrac{51\ \text{kWh}}{73\ \text{kW}} \approx 0.70\ \text{h}\]
Answer: About 42 minutes, which is why charging must be managed rather than allowed at full nameplate.
Auxiliary loads
Students often forget that a system consumes power to run itself. The canopy's auxiliary loads include the controller, network switch and cellular modem, about 60 W; the inverters' standby consumption; canopy lighting at night; the chargers' own electronics; and, largest by far, the battery cabinet's thermal management. Lithium iron phosphate cells must not be charged below about 0 °C, so in a Canadian or northern American winter the cabinet heats its cells, and its heaters and fans can draw a kilowatt or more on the coldest nights. The team budgeted 3 kW of auxiliaries in winter and 1 kW in summer, and treated the battery heaters' energy as a real loss in the energy balance. Leaving them out would have made winter look about 20 kWh a day better than it is.
Sizing decisions
Each major rating in the architecture traces to a requirement or a calculation. The battery's 215 kWh comes from the storm reserve, about 150 kWh above the floor, plus enough daily cycling to shave the evening peak; it is also a standard commercial cabinet size, which matters for cost and lead time. Its 100 kW rating allows it to carry the evening charging peak with the grid. The 100 kVA inverter rating matches the battery and leaves headroom for reactive power. The solar array's 36 kW DC is set by the canopy roof area over ten parking spaces, not by energy need; in winter it contributes little, and its main value is summer energy and the client's sustainability goal. The single 60 kW fast charger meets the crews' midday top-up need without pushing the site's peak beyond what grid and battery can supply together.
The architecture review
At the preliminary design review in week nine the team presented the requirements, the trade study and this architecture. The reviewers' main concern was the zero-margin winter case. Nadine asked what would happen if the fleet grew to ten vehicles. Leo had the answer ready because the energy balance was a program, not a spreadsheet he had built by hand: with two more vans the winter case would need either about 80 kWh more battery or acceptance that the two newest vehicles charge more slowly on the coldest nights. The client chose to record this as a future expansion note rather than change the design now. The PDR passed, with that action and two others on the interface document.
Common mistakes
MistakeChecking power ratings without an energy balance.
InsteadA system can meet every peak and still run out of energy overnight; do both.
MistakeLeaving communication failure behavior undefined.
InsteadSpecify what every device does when a link fails, and check that the result is safe.
MistakeForgetting auxiliary loads such as battery heating.
InsteadBudget auxiliary power for each season; in cold climates it can be large.
MistakePresenting a simple model as a prediction.
InsteadState the model's purpose and limits, and check it against published data.
Summary and key terms
- The architecture defines the blocks, interfaces, ratings and control links of the system.
- An interface control document records what crosses every interface and how failures behave.
- A power budget checks each operating condition against ratings.
- An hourly energy balance shows whether the system can meet demand through a whole day and night.
- The winter design case meets the 60 kW grid limit with no margin, so limit enforcement must be accurate.
- Auxiliary loads, especially battery heating in winter, must be included.
- Every major rating should trace to a requirement or a calculation.
- System architecture
- The arrangement of a system's major blocks and the interfaces between them.
- Interface control document (ICD)
- A document defining what crosses each interface and the limits that apply.
- Power budget
- A list of sources and loads for each operating condition, checked against ratings.
- Energy balance
- An accounting of energy produced, stored and used over a period.
- Site energy controller (SEC)
- The team-designed controller that coordinates the inverter, battery and chargers.
- Storm reserve floor
- The minimum battery state of charge held for emergency use.
- Auxiliary load
- Power the system consumes to operate itself.
Practice problems
Work each problem on paper first, then reveal the answer to check.
Why is the winter weekday the design case for the energy balance?
Show answer
Solar output is lowest and charging energy highest.
What does the zero margin in R2 imply for the controller?
Show answer
Its grid-limit enforcement must be accurate and fast.
Why are seven Level 2 chargers fed through a step-down transformer?
Show answer
They need 208 V single-phase circuits, not the service voltage.
How long can the battery carry 73 kW from 95 % to 70 % of 215 kWh at 95 % efficiency?
Show answer
About 0.7 hours.
Why must lithium iron phosphate cells be heated in winter?
Show answer
They must not be charged below about 0 °C.
What sets the size of the PV array?
Show answer
The canopy roof area over ten parking spaces.
Lesson quiz · 5 questions
Score 60% or more to complete this lesson.
Create a free account to save your progress, take quizzes and earn a certificate.