
ELE-499 · Lesson 10 of 12 · 21 min
Testing and validation
By week twenty the converter ran at full power and the site controller was driving emulated chargers in Cedarline's test bay. Hannah, as test lead, now ran the verification campaign the team had planned since the requirements review. Testing is where the claims in the report become evidence, and where honest teams find out which of their predictions were wrong. This lesson covers the test plan and procedures, measurement quality, the efficiency and thermal results, the control and protection tests, environmental and electromagnetic pre-compliance testing, and how the team reported results that did not match its predictions.
The test plan
The test plan, written in week eleven and updated at the CDR, listed every test, the requirement it verified, the equipment, the pass criterion, the procedure reference and the person responsible. It ordered the tests so that each built on the last: component and board tests first, then the converter alone, then the controller with emulated devices, then the converter and controller together, then the system scenarios. Each test had a written procedure with numbered steps, the expected result at each step, stop conditions, and space to record actual readings, the equipment serial numbers and the date. The procedures were reviewed by a second team member before use, and every safety-related step was copied from the laboratory safety plan.
| Test | Verifies | Pass criterion |
|---|---|---|
| T1 board bring-up | safe operation | all stages pass in order |
| T2 efficiency map | R5 | ≥ 97.5 % from 1.8 kW to 6 kW, both directions |
| T3 24-hour scaled run | R1, R2 | scaled fleet energy delivered, scaled limit never exceeded |
| T4 peak-limit test | R2, R8 | limit held within 1 kW during load steps |
| T5 islanded run | R4 | storm trucks served, reserve floor held |
| T6 SCADA and OCPP points | R6 | all points and commands verified end to end |
| T7 export relay test | R8 | trips at 1 kW ± 10 % after 2 s ± 0.1 s |
| T8 cold chamber | R7 | starts and runs at the lower temperature limit |
Measurement quality
A test result is only as good as the measurement behind it. Efficiency is a demanding measurement, because it is the ratio of two nearly equal numbers: at 98.3 %, an error of 0.1 % in either input or output power is about 6 % of the loss being measured. The team used a precision power analyzer borrowed from Cedarline, with current shunts on both sides of the converter, and checked its calibration certificate. They let the converter reach thermal equilibrium at each operating point before recording, because losses change as components warm, and repeated each point three times. Hannah estimated the uncertainty of each efficiency reading at about ±0.05 percentage points, small enough to judge the 97.5 % requirement but large enough that a reading of 97.51 % should be described as a narrow pass rather than a comfortable one.
Efficiency results
# Test results: fit a loss model to measured efficiency, check requirements, extrapolate the heat-run
meas = [(1200, 96.68), (2400, 97.89), (3600, 98.23), (4800, 98.31), (6000, 98.33)]   # W out, % efficiency
# loss = a + b*P + c*P^2 fitted by least squares (normal equations, 3x3)
rows = [(1.0, p, p * p, p * (100 / e - 1)) for p, e in meas]
S = [list(sum(r[i] * r[j] for r in rows) for j in range(3)) for i in range(3)]
t = [sum(r[i] * r[3] for r in rows) for i in range(3)]
for c in range(3):                                    # Gaussian elimination
    for r in range(c + 1, 3):
        f = S[r][c] / S[c][c]; S[r] = [x - f * y for x, y in zip(S[r], S[c])]; t[r] -= f * t[c]
x = [0.0] * 3
for r in (2, 1, 0): x[r] = (t[r] - sum(S[r][k] * x[k] for k in range(r + 1, 3))) / S[r][r]
a, b, c = x
print(f"loss model: {a:.1f} W fixed + {b * 1000:.2f} W/kW + {c * 1e6:.2f} W/kW^2")
for p in (1800, 3000, 6000):
    loss = a + b * p + c * p * p
    eff = p / (p + loss) * 100
    print(f"  {p / 1000:.1f} kW: predicted efficiency {eff:.2f} %  {'meets' if eff >= 97.5 else 'misses'} the 97.5 % requirement")
# heat-run at 22 C lab ambient; requirement: heat sink below 95 C at 40 C ambient and full load
temps = [(0, 22.0), (10, 48.5), (20, 60.2), (30, 65.4), (45, 68.3), (60, 69.1)]
rise = temps[-1][1] - temps[0][1]
print(f"steady sink rise {rise:.1f} K at 22 C -> {40 + rise:.1f} C at 40 C ambient (limit 95 C)")loss model: 33.9 W fixed + 4.74 W/kW + 1.10 W/kW^2 1.8 kW: predicted efficiency 97.51 % meets the 97.5 % requirement 3.0 kW: predicted efficiency 98.10 % meets the 97.5 % requirement 6.0 kW: predicted efficiency 98.33 % meets the 97.5 % requirement steady sink rise 47.1 K at 22 C -> 87.1 C at 40 C ambient (limit 95 C)
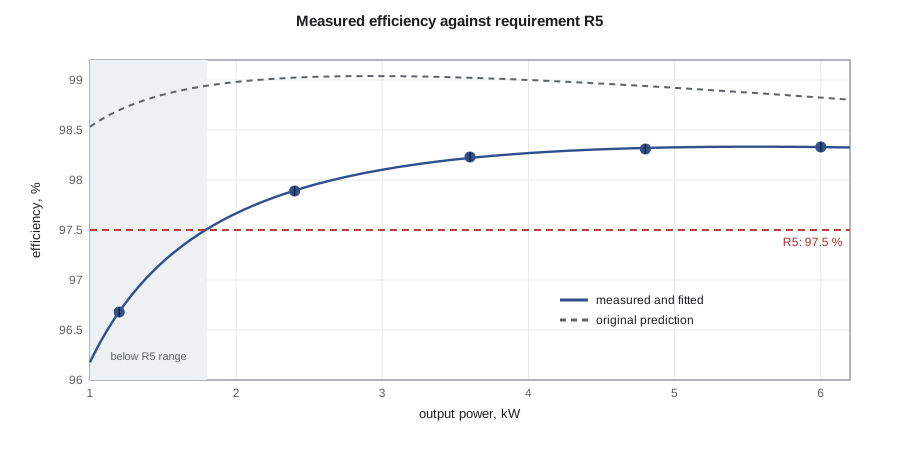
The measured efficiencies were lower than Aisha's prediction across the whole range. At 6 kW the converter measured 98.33 %, against the 98.8 % estimated in lesson 5; at 1.2 kW it measured 96.7 %. Fitting a loss model of the form fixed loss plus a term proportional to power plus a term proportional to power squared gave a fixed loss of about 34 W, a linear term of about 4.7 W per kilowatt and a quadratic term of about 1.1 W per kilowatt squared. The fitted model predicts 97.51 % at 1.8 kW, the 30 % point in requirement R5, so the requirement is met, but by a margin about the size of the measurement uncertainty.
Explaining the gap was more valuable than the numbers themselves. Aisha's prediction had about 74 W of loss at full power; the measurement implies about 101 W. The fixed loss, which appears at zero power, was larger than her allowance for gate drive and control because the gate drivers' isolated supplies and the fan drew more than estimated. Some of the extra loss at full power came from the gate resistor change made after simulation, which she had never carried back into the loss estimate, the logbook entry from week thirteen. And the inductors' winding loss was higher than calculated because she had used the DC resistance of the windings; at 50 kHz, the proximity effect raises the effective resistance of the ripple component. The report presented the measured results, the original prediction and this explanation, with a recommendation for the next revision: a lower-loss auxiliary supply and a winding of finer, stranded wire.
Thermal results
The heat run operated the converter at 6 kW until temperatures stopped changing, which took about an hour. In the 22 °C laboratory, the heat sink settled about 47 K above ambient. Extrapolating linearly to the 40 °C maximum ambient gives a sink temperature of about 87 °C, under the team's 95 °C limit. Linear extrapolation of temperature rise is reasonable over a modest range of ambient temperature, because thermal resistance changes only slightly, but the report noted that losses also rise with temperature, so a test in a warm chamber would be the proper confirmation for a production design.
Control and protection tests
Mateo repeated the current-loop step test from lesson 7 on the hardware, stepping the reference from 20 A to 29 A while recording the inductor currents with current probes. The measured overshoot was about 14 % and the 2 % settling time about 0.7 ms, slightly slower and less damped than the simulation predicted, mostly because the real sampling and computation delay was a little longer than modeled. Both met the design targets. The outer voltage loop was tested with load steps on the bus and held the 400 V bus within 2 % during a 3 kW step.
The site controller was tested against emulated devices: a programmable load standing in for the chargers, a second supply emulating the grid connection with a scaled 6 kW limit, and software emulations of the inverter and battery registers. Test T4 stepped loads on and off rapidly while the controller enforced the scaled limit; the worst overshoot was 0.6 kW for under a second, inside the 1 kW criterion. Communication-loss tests unplugged each link in turn and confirmed that every device fell back to its defined safe state within its timeout. The 24-hour scaled run, test T3, replayed a winter fleet schedule at one-tenth scale and delivered the scaled energy with the limit never exceeded.
Ravi brought a relay test set from Larchmont for test T7. With the same model of reverse-power relay specified for the canopy, he injected secondary currents and voltages representing increasing export. The relay picked up at 1.02 kW and tripped after 2.03 s, inside the criterion. He also confirmed that the relay's trip contact opened the demonstrator's contactor, which stood in for the canopy breaker.
Environmental and electromagnetic pre-compliance
For requirement R7, the converter and controller ran in the university's environmental chamber at −30 °C (−22 °F), the requirement's lower limit. After a two-hour soak, both started and ran normally, and R7 was reported as verified.
A prototype converter does not need certification, but the team checked its electromagnetic emissions to learn whether the design was on track. With a line impedance stabilization network borrowed from Cedarline, they measured conducted emissions on the DC input and compared them informally with the limits that would apply to commercial equipment. Emissions were close to the limit around the 100 kHz effective ripple frequency and its harmonics, which is typical for a hard-switched converter without a dedicated input filter. A near-field probe showed the strongest radiated fields around the inductors. The team recorded these as pre-compliance observations, not compliance results, and recommended a two-stage input filter for the next revision.
In the United States, unintentional radiators such as power converters in commercial products fall under FCC Part 15 for emissions; the team's measurements were for learning only and did not claim compliance.
Worked problem
How much loss does a 0.1 % error hide?
A converter measures 98.33 % at 6 kW output. How much loss is that, and how much does a 0.1 percentage-point measurement error change it?
Show solution
- \[P_{in} = 6000/0.9833 \approx 6101.9\ \text{W}, \quad P_{loss} \approx 101.9\ \text{W}\]
- At 98.23 %: P_in ≈ 6108.1 W, loss ≈ 108.1 W.
Answer: About 102 W of loss; a 0.1-point error changes the apparent loss by about 6 W, roughly 6 %.
When a test fails
Not every test passed the first time. The first run of test T4, the peak-limit test, exceeded the scaled grid limit by 1.8 kW for about three seconds when two emulated chargers started at once. Mateo traced it to the allocator's ramp: it raised each new session's setpoint over two seconds, but the emulated chargers, like real ones, took about a second to respond to each new setpoint, so the controller's measured import lagged behind the actual import. He shortened the ramp and added the margin below the limit that lesson 7 described, re-ran the test, and recorded both runs. A failed test that leads to a fix, documented with both results, is stronger evidence than a single clean pass, because it shows the test was capable of catching a real problem.
Reporting results honestly
Teams are tempted to present test results as confirmation of their design. Reviewers trust results that show the comparison with prediction, the uncertainty, any failures and their causes. Leo's team reported every test, including the probing incident during bring-up, the efficiency shortfall against prediction, and the partial verification of R7. Professor Gagnon later said the testing chapter was the strongest part of the report precisely because it explained where the design fell short and why.
Common mistakes
MistakeMeasuring efficiency with ordinary meters.
InsteadUse a calibrated power analyzer, reach thermal equilibrium and estimate uncertainty.
MistakeDescribing a pass within the measurement uncertainty as comfortable.
InsteadReport the margin and the uncertainty together.
MistakeClaiming a requirement is verified when the test could not reach its limit.
InsteadReport partial verification and put the gap on the handover list.
MistakePresenting pre-compliance scans as compliance.
InsteadLabel them as engineering observations; compliance needs accredited testing of the final product.
Summary and key terms
- A test plan links every test to a requirement with a pass criterion and a reviewed procedure.
- Efficiency is a ratio of nearly equal numbers, so small measurement errors are large fractions of the loss.
- The converter met R5 narrowly: 97.51 % predicted at 30 % load against 97.5 %.
- Measured losses exceeded prediction because of auxiliary power, an untracked gate resistor change and proximity-effect winding loss.
- Hardware control tests were close to simulation and met their targets.
- Relay, communication-loss and limit tests verified the protective and fallback behavior.
- Report partial results and pre-compliance findings honestly, with recommendations.
- Test procedure
- Numbered steps with expected results, stop conditions and space for recorded data.
- Power analyzer
- A precision instrument for measuring electrical power and efficiency.
- Thermal equilibrium
- The state in which temperatures have stopped changing under steady operation.
- Proximity effect
- Increased AC resistance of a winding caused by fields from neighboring conductors.
- Pre-compliance testing
- Informal emissions or immunity measurements made to guide design before formal testing.
- LISN
- A line impedance stabilization network used to measure conducted emissions.
- Relay test set
- Equipment that injects controlled currents and voltages to test protective relays.
Practice problems
Work each problem on paper first, then reveal the answer to check.
At 98.33 % efficiency and 6 kW output, what is the loss?
Show answer
About 102 W.
Why did the team wait for thermal equilibrium at each point?
Show answer
Losses change as components warm.
Give two reasons the measured loss exceeded the prediction.
Show answer
Auxiliary supply and fan power, the untracked gate resistor change, or proximity-effect winding loss.
The heat sink rose 47 K at 22 °C. What is its estimated temperature at 40 °C?
Show answer
About 87 °C.
What did the relay test show?
Show answer
Pickup at 1.02 kW and trip after 2.03 s, within the criteria.
Why are the conducted emission scans described as pre-compliance?
Show answer
They used borrowed equipment on a prototype and were not formal accredited tests.
Lesson quiz · 5 questions
Score 60% or more to complete this lesson.
Create a free account to save your progress, take quizzes and earn a certificate.