
CON-335 · Lesson 10 of 12 · 23 min
Productivity, crew sizing and trade density
Short-interval planning decides what work should happen, where and when. Whether it actually happens depends on the crews: how many workers each trade sends, how productive they are, and whether they have room to work. A takt plan that assumes a drywall crew can board a zone in five days is only as good as that assumption. This lesson covers how superintendents estimate and manage crew productivity in the field, how crew size interacts with the space available, how repetitive work gets faster as crews learn, and how to measure productivity in a way that leads to improvement rather than blame.
CON-410 discussed productivity measurement and the causes of low productivity in construction, and CON-305 covered managing productivity as a supervisor, including the published studies on overtime and fatigue. This lesson applies those ideas to sizing and managing crews in the interior trade train on Larkspur Commons.
Labor supply in 2026
Crew size starts with the people available. Associated Builders and Contractors estimated, in figures checked in October 2026, that the US construction industry would need about 349,000 net new workers in 2026 on top of normal hiring, and Idaho's fast-growing Treasure Valley has felt the shortage strongly. In practice, a subcontractor on Larkspur Commons may simply not have more drywall finishers or electricians to send, whatever the schedule says. Labor availability is therefore a real constraint on the look-ahead, not a matter of asking harder. Idaho is a right-to-work state and most residential and light commercial trades there are open shop, hiring directly, though some specialty trades are unionized.
This affects planning in three ways. Subcontractors must be asked about crew sizes several weeks ahead, which is why crew confirmation is part of the constraint screen in Lesson 6. Plans should avoid peaks in labor demand that no subcontractor can staff, which is one of the advantages of the level workload in a takt plan. And productivity improvements, which get more out of the same people, are worth more than ever.
Productivity, crew size and the space to work
Adding workers to a task usually shortens it, but not in proportion. Each extra worker adds less than the one before, and beyond a certain point extra workers actually slow the work because they get in each other's way, wait for tools and materials, and need more supervision. The point at which crowding starts depends on the type of work and the space available. Drywall hanging, for example, needs room to carry and lift sheets, set up lifts and benches, and keep corridors clear; electrical rough-in needs less floor space per worker but competes for wall and ceiling access.
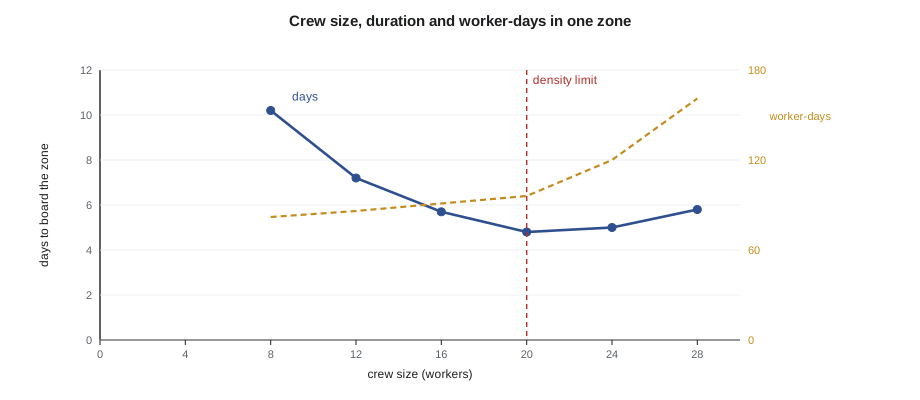
Mei estimated how crew size affects the drywall board wagon in one zone, using the rate the drywall subcontractor quoted for an uncrowded crew and a rough limit on the floor area each worker needs. The loss beyond the density limit is a simple illustrative assumption, not a published factor.
# Crew size, output and trade density for drywall board in one zone (US units, illustrative)
area = 51700                 # board to hang in the zone, sq ft (walls and ceilings)
rate = 650                  # sq ft per worker-day for a crew working without interference
space_per_worker = 650      # floor area each worker needs before crowding sets in, sq ft
floor_area = 13100          # zone floor area, sq ft
max_workers = floor_area // space_per_worker
print(f"Density limit: about {max_workers} workers in the zone")
for crew in (8, 12, 16, 20, 24, 28):
    crowding = max(0, crew - max_workers) / max_workers
    eff = 1 - 0.012 * max(0, crew - 6) - 0.6 * crowding   # illustrative: mild losses, then crowding
    days = area / (crew * rate * eff)
print(f"crew {crew:>2}: efficiency {eff:>4.0%}, {days:>4.1f} days, {crew * days:>5.1f} worker-days")Density limit: about 20 workers in the zone crew 8: efficiency 98%, 10.2 days, 81.5 worker-days crew 12: efficiency 93%, 7.1 days, 85.7 worker-days crew 16: efficiency 88%, 5.6 days, 90.4 worker-days crew 20: efficiency 83%, 4.8 days, 95.6 worker-days crew 24: efficiency 66%, 5.0 days, 119.8 worker-days crew 28: efficiency 50%, 5.7 days, 160.4 worker-days
The zone's board work takes about ten days with one crew of eight and about five and a half to six days with sixteen workers, which matches the 5.8-day first-zone estimate used later in this lesson. Twenty workers, the rough density limit, shave off almost another day, but beyond twenty the crowding loss is so large that the duration gets longer, not shorter, while the total worker-days climb steeply. The figures are illustrative, but the shape is typical: there is a crew size that gives the shortest duration without wasting labor, and pushing beyond it buys nothing at real cost.
This explains why the takt plan on Larkspur Commons runs two drywall board crews of eight, each working half the zone's area, rather than one large crew or a crew of twenty. Sixteen workers leave room below the density limit for the electricians finishing devices and the inspectors and engineers walking the zone, and Dana keeps the two crews in different halves of the zone so they do not interfere. It also explains why one wet trade per suite is a planning rule: a taper and a tile setter in the same bathroom both work slower than either would alone.
Overtime and stacking
When a trade falls behind, the quickest response is often overtime. CON-305 summarized the published studies, such as those by the Mechanical Contractors Association of America and the Business Roundtable, which show productivity falling during sustained overtime: a week or two of extended hours may increase output, but after several weeks of long days the extra hours produce little extra work because fatigue, errors and absenteeism rise. The exact percentages vary between studies and trades, and CON-305 treated them as indicative. The lesson for the superintendent is that overtime is a short-term tool for a specific problem, not a way to run a takt plan.
Stacking, which Lesson 4 described, has a similar effect. Trades crowded into the same zone lose productivity to interference, waiting and rework. Published productivity loss factors for stacking and congestion exist, but they are mostly used in claims and estimates rather than field planning (CON-420 discussed their use in disruption claims). In the field, it is usually more useful to prevent stacking through planning than to estimate its cost afterwards.
The learning curve on repetitive work
Crews get faster as they repeat similar work, because they learn the layout, set up their materials and tools better, and solve problems once rather than every time. This learning curve is strongest in the first few repetitions and flattens out later. A common model, first described for aircraft production by T. P. Wright in 1936, says that each time the cumulative number of units doubles, the time per unit falls to a fixed percentage of its previous value, called the learning rate.
For construction, learning rates between about 80 and 95 percent are often quoted for repetitive work, meaning that the time per unit falls by 5 to 20 percent each time the number of units doubles. The rate depends heavily on how similar the units are and whether the same crew stays on the job. Larkspur Commons's eight zones are nearly identical, so Dana expects noticeable learning, especially in the first few zones.
# Learning curve for the drywall board wagon across the eight zones (illustrative)
import math
t1 = 5.8                        # days for the first zone with the planned crew
for rate in (0.85, 0.90, 0.95):
    b = math.log(rate) / math.log(2)
    times = [t1 * n ** b for n in range(1, 9)]
    print(f"Learning rate {rate:.0%}: " + ", ".join(f"{t:.1f}" for t in times)
          + f"  total {sum(times):.1f} days")
takt = 5.0
b = math.log(0.90) / math.log(2)
first_ok = next(n for n in range(1, 9) if t1 * n ** b <= takt)
print(f"At 90%, the wagon first fits the {takt:.0f}-day takt in zone {first_ok}")Learning rate 85%: 5.8, 4.9, 4.5, 4.2, 4.0, 3.8, 3.7, 3.6 total 34.4 days Learning rate 90%: 5.8, 5.2, 4.9, 4.7, 4.5, 4.4, 4.3, 4.2 total 38.1 days Learning rate 95%: 5.8, 5.5, 5.3, 5.2, 5.1, 5.1, 5.0, 5.0 total 42.1 days At 90%, the wagon first fits the 5-day takt in zone 3
If the first zone takes just under six days and the learning rate is 90 percent, the board wagon fits the five-day takt from the third zone onward, which matches Dana's expectation in Lesson 4 that the trades would reach takt by the third zone. That is why the first two zones were planned with a little buffer. A learning curve also warns against judging a crew's performance on the first zone alone: a crew that is slow at first may be fine once it has learned the layout, and replacing it would throw away that learning.
Learning can be lost. When a crew is moved to another project and replaced, the new crew starts near the top of the curve again. When the units change, such as a different suite type on one floor, part of the learning is lost. This is another reason to keep crews stable on the trade train and to ask subcontractors not to rotate workers between projects.
Measuring productivity on site
Productivity can be measured in two main ways on a building site. The first is output per labor hour: square feet of board per worker-hour, fixtures set per day, and so on, compared with the estimate. The second is how workers spend their time: the share of time spent on direct installation work compared with preparation, waiting, traveling and other activities. CON-410 described both. On Larkspur Commons, Dana uses output rates to track each wagon against the takt plan, and occasional work sampling studies to find out why rates are low.
Work sampling observes a crew at random moments and records what each worker is doing at that instant. Over many observations, the share of observations in each category estimates the share of time. Omar carried out a short study of the electrical rough-in crew over three days.
# Work sampling of the electrical rough-in crew (illustrative counts)
import math
obs = {"Direct work (installing)": 212, "Preparation and layout": 74, "Getting materials or tools": 61,
       "Waiting for access or information": 38, "Moving between areas": 29, "Breaks and personal": 26}
n = sum(obs.values())
for k, v in sorted(obs.items(), key=lambda kv: -kv[1]):
    p = v / n
    half = 1.96 * math.sqrt(p * (1 - p) / n)         # approximate 95% interval
    print(f"{k:<36}{p:>5.0%}  (+/- {half:.0%})")
print(f"{n} observations; direct work about {obs['Direct work (installing)'] / n:.0%} of the time")Direct work (installing) 48% (+/- 5%) Preparation and layout 17% (+/- 3%) Getting materials or tools 14% (+/- 3%) Waiting for access or information 9% (+/- 3%) Moving between areas 7% (+/- 2%) Breaks and personal 6% (+/- 2%) 440 observations; direct work about 48% of the time
The crew spent about half its time on direct installation, with about 14 percent getting materials or tools and almost 9 percent waiting. These figures are fairly typical of construction work sampling studies. The two largest non-direct categories pointed to specific fixes: materials staged in each zone in kits by suite, rather than carried up from a central store, and earlier resolution of the coordination questions that kept the electricians waiting. Six weeks later, a repeat study showed direct work up to about 58 percent.
Work sampling must be done openly and explained to the crew and the foreman as a study of the system, not of individual workers. If workers believe they are being timed for discipline, they will change what they do while observed and the study will be useless. Dana shares the results with the foremen first and asks them what would help, which usually produces better ideas than the superintendent's own.
Kitting and material staging
One of the most effective ways to raise direct work time in interiors is to deliver materials to each zone in kits: all the materials a crew needs for a suite or a group of suites, sorted and labeled, staged in the zone before the crew arrives. Plumbing fittings, electrical boxes and devices, door hardware and cabinet parts lend themselves well to kitting. Kits reduce trips to a central store, prevent shortages and reduce waste and theft. They need space, which must be planned in the zone and the hoist schedule (CON-325), and they need the supplier or the subcontractor's shop to do the sorting.
Making crew decisions with the foremen
Crew size is ultimately the subcontractor's decision, within the obligations of its subcontract. The superintendent's role is to make the need clear and early, to show the trade where crowding or waiting is hurting its productivity, and to plan the zones so that the crew can work efficiently. Conversations based on data, such as the crew-size curve, the learning curve or a work sampling result, are more productive than general demands for more people. A foreman who sees that a ninth or tenth worker would mostly stand in the way of the first eight is unlikely to push for one, and a subcontractor who sees that waiting time is costing its crew a fifth of each day will welcome help fixing it.
Common mistakes
MistakeAssuming that doubling a crew halves the duration.
InsteadAccount for diminishing returns and the density limit of the zone.
MistakeUsing sustained overtime to keep a takt plan on schedule.
InsteadUse overtime briefly for specific problems; fix crew size or the cause of the delay.
MistakeJudging a crew on its first zone.
InsteadExpect a learning curve on repetitive work and plan buffer for the early zones.
MistakeRotating workers between projects.
InsteadKeep crews stable on the trade train so their learning is not lost.
MistakeUsing work sampling to discipline individuals.
InsteadExplain it as a study of the system, share results with the foremen and ask them for fixes.
Summary and key terms
- Labor shortages make crew size a real constraint on the look-ahead; ask subcontractors early and avoid unstaffable peaks.
- Adding workers gives diminishing returns, and beyond the zone's density limit extra workers add cost but little speed.
- Two smaller crews in separate halves of a zone can be better than one large crew.
- Sustained overtime and stacking reduce productivity; published loss factors are indicative and best avoided through planning.
- Repetitive work follows a learning curve; at Larkspur Commons the board wagon is expected to reach takt by the third zone.
- Learning is lost when crews change or units differ, so keep crews stable.
- Productivity can be measured as output per hour and as the share of time in direct work; work sampling reveals the causes of low output.
- Kitting and staging materials by zone and data-based conversations with foremen raise direct work time.
- Crew size
- The number of workers a trade assigns to a task.
- Density limit
- The number of workers an area can hold before crowding reduces productivity.
- Diminishing returns
- Each additional worker adds less output than the previous one.
- Learning curve
- The reduction in time per unit as a crew repeats similar work.
- Learning rate
- The percentage to which time per unit falls each time the cumulative number of units doubles.
- Work sampling
- Observing workers at random moments to estimate how time is spent.
- Direct work
- Time spent physically installing work, as opposed to preparing, waiting or traveling.
- Kitting
- Sorting and staging all materials for a defined piece of work before the crew arrives.
Practice problems
Work each problem on paper first, then reveal the answer to check.
Why is labor availability treated as a constraint in the look-ahead?
Show answer
Because subcontractors may not have more workers to send; crew sizes must be confirmed weeks ahead.
In the crew-size example, what was the density limit and why did worker-days rise above it?
Show answer
About twenty workers; beyond that, crowding cut efficiency so much that the duration grew longer while worker-days rose steeply.
Why does the takt plan use two board crews of eight in different halves of the zone?
Show answer
Sixteen workers stay below the density limit with room for other trades, and separate halves avoid interference between the crews.
With t1 = 6 days and a 90 percent learning rate, in which zone does the board wagon first fit a 5-day takt?
Show answer
The third zone.
Give two ways learning is lost.
Show answer
Crews are replaced or rotated, and the units change, such as a different suite type.
What share of the electrical crew's time was direct work, and what were the two largest non-direct categories?
Show answer
About 48 to 50 percent; preparation and layout, and getting materials or tools.
What changes followed the work sampling study?
Show answer
Materials were kitted by suite in each zone and coordination questions were resolved earlier.
How should work sampling be presented to the crew?
Show answer
As a study of the system, not of individuals, with results shared with the foremen first.
Lesson quiz · 5 questions
Score 60% or more to complete this lesson.
Create a free account to save your progress, take quizzes and earn a certificate.