
CMPUT-450 · Lesson 11 of 12 · 35 min
Fault tolerance, failure detection and resilience patterns
The earlier lessons gave algorithms that remain correct despite failures: quorums, consensus, commit protocols. Running a real system adds a second layer of concerns. Failures must be detected before they can be handled. Overloaded or misbehaving components must be contained so that their problems do not spread. Recovery must be fast and routine, not a heroic act. And the whole system needs a clear, measurable definition of being reliable enough. This lesson covers failure detection, redundancy, checkpointing, the resilience patterns used in service architectures, the practices of site reliability engineering, and two large outages that show how failures cascade.
Failure detectors
Every fault-tolerance mechanism starts by noticing a failure. A failure detector is a component that tells each process which other processes it suspects have crashed. Chandra and Toueg (1996) characterized detectors by two properties: completeness, that crashed processes are eventually suspected, and accuracy, that correct processes are not suspected (or, for eventual accuracy, are eventually no longer suspected). In an asynchronous system no detector can be both complete and accurate, for the reasons given in lesson 1; real detectors trade one against the other through their timeouts.
The simplest detector uses heartbeats: each process sends a small message every interval, and a process that misses several in a row is suspected. A fixed timeout is fragile, because normal delays change with load and network conditions. Adaptive detectors learn the distribution of heartbeat arrival times and set thresholds accordingly. The phi accrual detector of Hayashibara and colleagues (2004), used in Cassandra and Akka, outputs not a binary verdict but a suspicion level \(\varphi\) that rises continuously with the time since the last heartbeat. A value of \(\varphi = 1\) means a 10 percent chance that a live node would be this late; \(\varphi = 8\) means one in a hundred million. Applications choose their own threshold: a load balancer may stop sending traffic at a low \(\varphi\), while a cluster manager waits for a high one before re-replicating data.
# The phi accrual failure detector (Hayashibara et al. 2004), as used by Cassandra and Akka.
# Instead of a yes/no timeout it outputs a suspicion level phi = -log10 P(heartbeat this late).
import math, random, statistics
random.seed(450)

arrivals = [random.gauss(1000, 40) for _ in range(200)]       # heartbeat gaps in ms, mean 1 s
mu, sigma = statistics.mean(arrivals), statistics.stdev(arrivals)

def phi(elapsed_ms):
    # P(gap > elapsed) under a normal model; use the complementary error function
    p_later = 0.5 * math.erfc((elapsed_ms - mu) / (sigma * math.sqrt(2)))
    return -math.log10(max(p_later, 1e-300))

print(f"learned heartbeat gap: mean {mu:.0f} ms, std dev {sigma:.0f} ms")
for elapsed in (900, 1000, 1080, 1120, 1160, 1200, 1500):
    p = phi(elapsed)
    verdict = "suspect" if p >= 8 else ("uneasy" if p >= 3 else "fine")
    print(f"{elapsed:5d} ms since last heartbeat: phi = {p:6.2f}  ({verdict})")
print("phi = 8 means the chance of a heartbeat this late from a live node is 1 in 100 million")learned heartbeat gap: mean 994 ms, std dev 41 ms 900 ms since last heartbeat: phi = 0.00 (fine) 1000 ms since last heartbeat: phi = 0.35 (fine) 1080 ms since last heartbeat: phi = 1.73 (fine) 1120 ms since last heartbeat: phi = 2.95 (fine) 1160 ms since last heartbeat: phi = 4.55 (uneasy) 1200 ms since last heartbeat: phi = 6.54 (uneasy) 1500 ms since last heartbeat: phi = 34.28 (suspect) phi = 8 means the chance of a heartbeat this late from a live node is 1 in 100 million
Large clusters cannot have every node send heartbeats to every other node, which costs messages proportional to the square of the cluster size. Gossip-based membership protocols such as SWIM (Das, Gupta and Motivala, 2002), used in HashiCorp's Serf and Consul, have each node periodically probe one random peer, ask a few others to probe indirectly if the direct probe fails, and spread membership changes by piggybacking on these messages. Detection time and load per node stay roughly constant as the cluster grows.
Redundancy and its limits
The basic tool of fault tolerance is redundancy: more than one of everything that can fail. Replicated data (lesson 6), multiple instances of every stateless service, several network paths, power supplies and data centers. Redundancy improves availability dramatically, but only when the redundant parts fail independently. Two replicas in the same rack share a power feed and a top-of-rack switch; two services in the same region share the region's control plane; and identical software on every replica shares every bug. Correlated failures, where one cause takes down many supposedly independent components, cause most large outages. Designers therefore spread replicas across failure domains: different racks, different availability zones (separate data centers within a region with independent power and cooling), and sometimes different regions. The DCE program covers the physical side of this: power and cooling redundancy and the Uptime Institute tiers.
# Availability arithmetic: replicas, dependencies and error budgets.
from math import comb

def k_of_n(k, n, a):
    """Probability that at least k of n independent replicas (each available with prob a) are up."""
    return sum(comb(n, i) * a**i * (1 - a)**(n - i) for i in range(k, n + 1))

def nines(p): return f"{p * 100:.5f}%"
a = 0.99                                              # each machine is up 99% of the time
print("single machine:            ", nines(a))
print("1 of 2 replicas (failover):", nines(k_of_n(1, 2, a)))
print("majority 2 of 3 (Raft):    ", nines(k_of_n(2, 3, a)))
print("majority 3 of 5 (Raft):    ", nines(k_of_n(3, 5, a)))
chain = 0.9995 ** 4                                   # four services in series, each 99.95%
print("4 dependencies in series at 99.95% each:", nines(chain))

for slo in (0.99, 0.999, 0.9999):
    minutes = (1 - slo) * 30 * 24 * 60
print(f"SLO {slo:.2%}: error budget {minutes:7.1f} minutes of downtime per 30 days")single machine: 99.00000% 1 of 2 replicas (failover): 99.99000% majority 2 of 3 (Raft): 99.97020% majority 3 of 5 (Raft): 99.99901% 4 dependencies in series at 99.95% each: 99.80015% SLO 99.00%: error budget 432.0 minutes of downtime per 30 days SLO 99.90%: error budget 43.2 minutes of downtime per 30 days SLO 99.99%: error budget 4.3 minutes of downtime per 30 days
The numbers show both sides. Three independent machines that are each up 99 percent of the time give a majority quorum available 99.97 percent of the time; five give better than 99.999 percent. But a request that depends on four services in series, each 99.95 percent available, is only about 99.8 percent available, worse than any of its parts. Every synchronous dependency added to a request path lowers its availability, which is why resilient systems minimize the number of components a request must pass through and degrade gracefully when optional ones fail.
Checkpointing and recovery
Long computations and stateful services need to recover their state after a crash without starting from the beginning. Checkpointing periodically saves state to stable storage, and recovery restores the latest checkpoint and replays any log since it. The interval trades the cost of taking checkpoints against the work lost on failure; Young's approximation suggests a checkpoint interval of about \(\sqrt{2 \times C \times M}\), where \(C\) is the time to take a checkpoint and \(M\) is the mean time between failures. Distributed checkpoints must be consistent, which is exactly the Chandy–Lamport problem of lesson 4; stream processors such as Flink and large training jobs (AI-480, lesson 11) take coordinated checkpoints for this reason. Recovery is fastest when components are designed to crash safely: crash-only software, a term from Candea and Fox (2003), has only one way to stop, crashing, and one way to start, recovery, so the recovery path is exercised constantly and is known to work.
Resilience patterns
Service architectures rely on a set of patterns, popularized by Michael Nygard's book Release It! (2007) and by Netflix's engineering practices, that keep one failing component from taking down others.
| Pattern | Problem it addresses | How it works |
|---|---|---|
| Timeouts and deadlines | Calls that hang forever | Bound every remote call; propagate the remaining time (lesson 2) |
| Retries with backoff and jitter | Transient failures | Retry idempotent calls a limited number of times, spread out (lesson 2) |
| Circuit breaker | Calls to a failing dependency waste resources and add latency | After repeated failures, fail fast for a while, then probe before resuming |
| Bulkhead | One slow dependency exhausts shared threads or connections | Give each dependency its own bounded pool, like watertight compartments in a ship |
| Load shedding | Overload causes everyone to time out | Reject excess or low-priority work early |
| Graceful degradation | An optional feature's failure breaks the whole page | Serve a reduced response, such as cached data or no recommendations |
| Rate limiting | One client floods a shared service | Cap requests per client, often with token buckets |
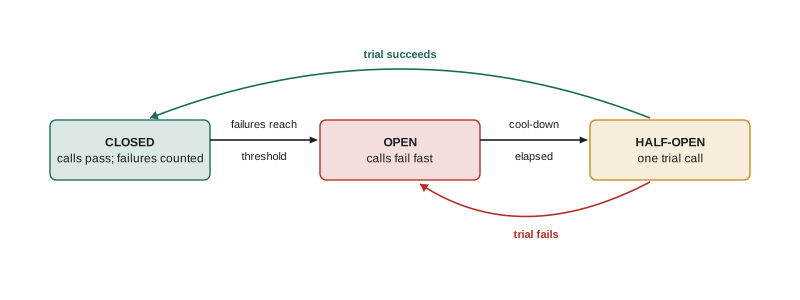
The circuit breaker deserves a closer look. It wraps calls to a dependency and has three states. When closed, calls pass through and failures are counted. When failures exceed a threshold, the breaker opens: calls fail immediately without touching the dependency, which protects both the caller, which no longer wastes threads waiting, and the dependency, which gets a chance to recover. After a cool-down period, the breaker goes half-open and lets a trial call through; if it succeeds, the breaker closes, and if it fails, it opens again.
# A circuit breaker: stop calling a failing dependency, then probe it before trusting it again.
class CircuitBreaker:
    def __init__(self, threshold=3, cooldown=5):
        self.state, self.fails, self.threshold, self.cooldown, self.opened_at = "CLOSED", 0, threshold, cooldown, None
    def call(self, t, dependency_ok):
        if self.state == "OPEN":
            if t - self.opened_at < self.cooldown:
                return "fail fast (breaker open)"
            self.state = "HALF-OPEN"                      # let one trial request through
        trial = self.state == "HALF-OPEN"
        if dependency_ok:
            self.state, self.fails = "CLOSED", 0
            return "trial request ok" if trial else "ok"
        self.fails += 1
        if trial or self.fails >= self.threshold:
            self.state, self.opened_at = "OPEN", t
        return "trial request failed" if trial else "error"

cb = CircuitBreaker()
dependency_up = lambda t: not (3 <= t < 12)             # the ledger is down from t=3 to t=11
for t in range(16):
    result = cb.call(t, dependency_up(t))
print(f"t={t:2d} ledger {'up ' if dependency_up(t) else 'down'} -> {result:26s} breaker {cb.state}")t= 0 ledger up -> ok breaker CLOSED t= 1 ledger up -> ok breaker CLOSED t= 2 ledger up -> ok breaker CLOSED t= 3 ledger down -> error breaker CLOSED t= 4 ledger down -> error breaker CLOSED t= 5 ledger down -> error breaker OPEN t= 6 ledger down -> fail fast (breaker open) breaker OPEN t= 7 ledger down -> fail fast (breaker open) breaker OPEN t= 8 ledger down -> fail fast (breaker open) breaker OPEN t= 9 ledger down -> fail fast (breaker open) breaker OPEN t=10 ledger down -> trial request failed breaker OPEN t=11 ledger down -> fail fast (breaker open) breaker OPEN t=12 ledger up -> fail fast (breaker open) breaker OPEN t=13 ledger up -> fail fast (breaker open) breaker OPEN t=14 ledger up -> fail fast (breaker open) breaker OPEN t=15 ledger up -> trial request ok breaker CLOSED
Chaos engineering
If failure handling is exercised only during real failures, it will often not work when needed. Chaos engineering, pioneered by Netflix with its Chaos Monkey tool around 2011, deliberately injects failures into production or production-like systems, killing instances, adding latency, partitioning networks, to verify that the system tolerates them. The discipline, as Netflix's principles describe it, is experimental: define a measurable steady state, hypothesize that it will hold during a failure, inject the failure in a limited blast radius, and look for a difference. Game days, in which teams rehearse failures such as losing an availability zone, serve the same purpose for people and runbooks. Cloud providers now offer managed fault-injection services, and the practice is common among large operators.
Site reliability engineering
Google's Site Reliability Engineering book (2016) codified practices for running large systems reliably. Three ideas are central. A service level indicator (SLI) is a measurement of service quality as users experience it, such as the fraction of requests served successfully within 300 ms. A service level objective (SLO) is a target for an SLI over a window, such as 99.9 percent over 30 days. A service level agreement (SLA) is a contract with consequences, usually looser than the internal SLO. ITIL-141 (lessons 2 and 3) covers SLAs and service level management from the service management side; SRE adds the engineering mechanism that makes them operational, the error budget.
The error budget is the allowed unreliability: an SLO of 99.9 percent allows 0.1 percent of requests to fail, about 43 minutes of full outage per 30 days. While budget remains, teams may ship changes freely, since change is the main cause of outages; when the budget is spent, they slow down and invest in reliability. This turns the argument between moving fast and being reliable into a shared, numerical decision. It also makes clear that 100 percent is the wrong target: users cannot distinguish 99.999 from 100 percent when their own network is less reliable than that, and each additional nine costs roughly ten times as much.
How outages cascade: two case studies
Real outages rarely have a single cause; they are chains in which a small fault meets a system condition that amplifies it. Two widely reported incidents illustrate the patterns from this course.
On 19 and 20 October 2025, Amazon Web Services' us-east-1 region suffered a major disruption. According to AWS's published post-event summary, a latent race condition in the automated system that manages DNS records for DynamoDB's regional endpoint left that endpoint with an empty DNS record, which the automation failed to repair. Clients, including other AWS services, could not resolve DynamoDB's address. The failure cascaded: a subsystem that launches EC2 instances depends on DynamoDB, so new instances could not complete network configuration, and delayed network state in turn caused health checks in Network Load Balancer to fail, removing capacity. Many widely used applications were affected, some for many hours. AWS's remediation included disabling the DNS automation worldwide until the race condition was fixed, adding protections against applying incorrect DNS plans, and adding velocity controls so that a load balancer cannot remove too much capacity at once when health checks fail. The lessons echo this course: a race in a distributed control plane, hidden dependencies between services, and automated responses (removing unhealthy capacity) that amplify a failure unless they are rate-limited.
On 19 July 2024, a faulty content update to CrowdStrike's Falcon endpoint security sensor, a configuration file known as Channel File 291, caused Windows machines running the sensor to crash with an out-of-bounds memory read; Microsoft estimated that about 8.5 million devices were affected. Airlines, hospitals, banks and broadcasters were disrupted, and many machines had to be repaired by hand because they crashed on every boot. This was not a distributed consensus failure, but it is the starkest recent example of correlated failure: identical software, updated everywhere at once, failing everywhere at once. CrowdStrike's root cause analysis described changes including staged deployment of such content updates and additional validation. The general lesson is that redundancy does not help when every replica runs the same faulty change at the same moment, so changes, including configuration and data, must roll out gradually with automated checks and quick rollback.
Blameless postmortems
After an incident, SRE practice calls for a written postmortem that records the timeline, impact, root causes, contributing factors and action items. Postmortems are blameless: they assume people acted reasonably given the information and tools they had, and look for the system conditions that made the error possible or its impact large. Blame discourages people from reporting problems and reveals little about how to prevent recurrence; understanding why a mistake was easy to make leads to better tools, safer defaults and stronger safeguards. Many companies publish external postmortems, which are among the best free education in distributed systems available.
Worked examples
Worked problem
Spending an error budget
Ledgerline's payment API has an SLO of 99.95 percent of requests succeeding over 30 days and serves about 50 million requests a month. A bad deployment caused 40,000 failed requests. How much budget remains, and what should the team do?
Show solution
- Budget: \(0.0005 \times 50{,}000{,}000 = 25{,}000\) failed requests per 30 days.
- 40,000 failures exceed the budget by 15,000.
- Policy: freeze risky changes until the 30-day window recovers, and prioritize the action items from the postmortem, such as canary deployments.
Answer: The budget is overspent by 60 percent; slow releases and invest in reliability until the window recovers.
Worked problem
Availability of a request path
A request passes through a load balancer (99.99%), an API service (99.95%), the ledger (99.95%) and a fraud-scoring service (99.9%). What is the path's availability? What if fraud scoring is made optional with a fallback rule?
Show solution
- In series: \(0.9999 \times 0.9995 \times 0.9995 \times 0.999 \approx 0.9979\), about 99.79 percent.
- Without the fraud service in the critical path: \(0.9999 \times 0.9995 \times 0.9995 \approx 0.9989\).
- The fallback, such as a simple rule-based check, keeps payments flowing when the scorer is down.
Answer: About 99.79 percent with a hard dependency; about 99.89 percent with graceful degradation, halving expected downtime.
Worked problem
Choosing a checkpoint interval
A reconciliation job takes 30 seconds to checkpoint, and a worker fails on average every 10 hours. Estimate a good checkpoint interval with Young's formula.
Show solution
- C = 30 s and M = 10 h = 36,000 s.
- \(\sqrt{2 \times 30 \times 36{,}000} = \sqrt{2{,}160{,}000} \approx 1{,}470\) s.
- About every 25 minutes.
Answer: Checkpoint roughly every 25 minutes; more often wastes time on checkpoints, less often loses more work per failure.
Common mistakes
MistakeUse a single fixed timeout for failure detection everywhere.
InsteadAdapt to measured latency (for example phi accrual) and let each consumer choose its own threshold.
MistakePlace all replicas in one rack or one availability zone.
InsteadSpread replicas across failure domains so they fail independently.
MistakeAdd synchronous dependencies freely to a request path.
InsteadEach one multiplies unavailability; make optional dependencies asynchronous or degradable.
MistakeLet health-check failures remove unlimited capacity automatically.
InsteadRate-limit automated remediation so it cannot amplify a partial failure.
MistakeRoll out configuration or content updates to every machine at once.
InsteadStage all changes with canaries, automated checks and fast rollback.
Summary and key terms
- Failure detectors trade completeness against accuracy; adaptive detectors such as phi accrual output graded suspicion.
- Gossip protocols such as SWIM scale failure detection and membership to large clusters.
- Redundancy works only if failures are independent; spread replicas across racks, zones and regions, and beware correlated failures.
- Availability multiplies along series dependencies and improves dramatically with independent replicas and majority quorums.
- Checkpointing bounds lost work; distributed checkpoints must be consistent cuts; crash-only design keeps recovery paths tested.
- Timeouts, retries with jitter, circuit breakers, bulkheads, load shedding and graceful degradation contain failures.
- SRE defines reliability with SLIs and SLOs, manages change with error budgets, rehearses failure with chaos engineering, and learns through blameless postmortems.
- Failure detector
- A component that reports which processes are suspected to have crashed.
- Heartbeat
- A periodic message signaling that its sender is alive.
- Phi accrual detector
- A failure detector that outputs a continuous suspicion level based on the heartbeat distribution.
- Correlated failure
- A single cause that makes many supposedly independent components fail together.
- Failure domain
- A set of components that can fail together, such as a rack, zone or region.
- Checkpoint
- A saved copy of state from which a process can recover.
- Circuit breaker
- A wrapper that stops calls to a failing dependency for a while and probes before resuming.
- Bulkhead
- Isolating resources per dependency so one failure cannot exhaust shared capacity.
- Chaos engineering
- Deliberately injecting failures to verify that a system tolerates them.
- Service level objective
- A target value for a service level indicator over a time window.
- Error budget
- The amount of unreliability an SLO allows, used to govern the pace of change.
Practice problems
Work each problem on paper first, then reveal the answer to check.
What two properties characterize a failure detector?
Show answer
Completeness and accuracy.
What does a phi value of 3 mean?
Show answer
A live node would be this late with probability about 1 in 1,000.
Why do large clusters use gossip-based membership?
Show answer
All-to-all heartbeats cost messages quadratic in cluster size; gossip keeps per-node cost roughly constant.
Each of three independent replicas is up 99 percent of the time. What is the availability of a majority quorum?
Show answer
About 99.97 percent.
Why can redundancy fail to prevent an outage?
Show answer
Correlated failures, such as shared power or identical faulty software, take down all replicas together.
What does a circuit breaker do in the half-open state?
Show answer
Lets a trial request through to test whether the dependency has recovered.
What is a bulkhead?
Show answer
A separate, bounded pool of resources per dependency so one slow dependency cannot exhaust everything.
How many minutes of downtime does a 99.99 percent monthly SLO allow?
Show answer
About 4.3 minutes per 30 days.
Name two lessons from the October 2025 us-east-1 outage.
Show answer
Races in automated control planes can be latent for years; automated remediation such as removing unhealthy capacity must be rate-limited.
Why are postmortems blameless?
Show answer
To encourage reporting and to focus on the system conditions that allowed the failure.
Lesson quiz · 5 questions
Score 60% or more to complete this lesson.
Create a free account to save your progress, take quizzes and earn a certificate.