
CHE-320 · Lesson 6 of 12 · 21 min
Modified Raoult's law and activity coefficients
The rectifier at Kingfisher Bioenergy takes a stream of about 40 % ethanol by mass from the beer column and concentrates it to about 95 %. Every tray in it works at the equilibrium between a liquid and a vapor of ethanol and water. Lesson 5 showed that Raoult's law misses that equilibrium badly. Theo pulls the published equilibrium data for ethanol-water at 1 atm from the handbook, and this lesson turns those data into activity coefficients, the correction factors that make Raoult's law work for real liquids.
Activity and the activity coefficient
For a liquid that is not an ideal solution, the fugacity of each component is written as its ideal-solution value times a correction:
The activity coefficient \(\gamma_i\) measures how much more or less the species escapes from the mixture than it would from an ideal solution of the same composition. The product \(a_i = x_i\gamma_i\) is the activity. When \(\gamma_i > 1\), the molecules of \(i\) are less comfortable among their neighbors than among their own kind and escape more readily: a positive deviation from Raoult's law. When \(\gamma_i < 1\), the mixture holds them more tightly: a negative deviation. By definition, \(\gamma_i \to 1\) as \(x_i \to 1\), because a nearly pure liquid is its own ideal solution.
The activity coefficient is connected to the excess Gibbs energy of lesson 2. The partial molar excess Gibbs energy of species \(i\) is \(\bar{G}_i^E = RT\ln\gamma_i\), so the summability relation gives
Activity coefficients therefore obey the Gibbs-Duhem equation: at constant temperature and pressure, \(\sum_i x_i\,d\ln\gamma_i = 0\). For a binary, if \(\gamma_1\) falls as \(x_1\) rises, \(\gamma_2\) must rise in a related way.
Modified Raoult's law
Keeping the ideal-gas vapor and low-pressure liquid fugacity of lesson 5, but using activity coefficients for the liquid, gives the equation used for most low-pressure vapor-liquid equilibrium:
It holds well below a few bar for most chemical systems. At higher pressures the full gamma-phi form adds the vapor fugacity coefficient, \(\phi^{\text{sat}}\) and the Poynting factor: \(y_i\hat{\phi}_iP = x_i\gamma_i\phi_i^{\text{sat}}P_i^{\text{sat}}\exp[V_i^{\text{L}}(P - P_i^{\text{sat}})/RT]\). In this lesson the simple form is enough. The relative volatility now includes the activity coefficients: \(\alpha_{12} = \gamma_1P_1^{\text{sat}}/(\gamma_2P_2^{\text{sat}})\), and because the \(\gamma\) values change with composition, so does \(\alpha\).
Activity coefficients from vapor-liquid data
Rearranging modified Raoult's law gives each activity coefficient directly from one measured point: \(\gamma_i = y_iP/(x_iP_i^{\text{sat}})\), with the vapor pressure evaluated at the measured temperature. This is how activity coefficient data are generated. The code applies it to thirteen published points for ethanol-water at 1 atm, rounded from a standard handbook table.
# Activity coefficients of ethanol (1) and water (2) from isobaric data at 1 atm (modified Raoult's law)
import math
ant = {"ethanol": (8.20417, 1642.89, 230.300), "water": (8.07131, 1730.63, 233.426)}
def psat(c, T):
    A, B, C = ant[c]; return 10 ** (A - B / (T + C)) * 0.133322   # kPa, T in C
P = 101.325
# x1, y1, T/C: published data for ethanol-water at 1 atm, rounded
data = [(0.0190, 0.1700, 95.5), (0.0721, 0.3891, 89.0), (0.0966, 0.4375, 86.7), (0.1238, 0.4704, 85.3),
        (0.1661, 0.5089, 84.1), (0.2337, 0.5445, 82.7), (0.3273, 0.5826, 81.5), (0.3965, 0.6122, 80.7),
        (0.5079, 0.6564, 79.8), (0.5732, 0.6841, 79.3), (0.6763, 0.7385, 78.74), (0.7472, 0.7815, 78.41),
        (0.8943, 0.8943, 78.15)]
print("  x1      T     g1     g2    ln(g1/g2)   GE/RT")
rows = []
for x1, y1, T in data:
    g1 = y1 * P / (x1 * psat("ethanol", T))
    g2 = (1 - y1) * P / ((1 - x1) * psat("water", T))
    ge = x1 * math.log(g1) + (1 - x1) * math.log(g2)
    rows.append((x1, math.log(g1 / g2)))
    print(f"{x1:6.4f}  {T:6.2f}  {g1:5.3f}  {g2:5.3f}  {math.log(g1 / g2):8.3f}  {ge:7.4f}")

# Redlich-Kister area test: the integral of ln(g1/g2) from x1 = 0 to 1 should be close to zero
# (strictly true at constant T; isobaric data pass if the net area is a small fraction of the total)
pts = [(0.0, 2.1)] + rows + [(1.0, -1.0)]       # end values extrapolated by eye from the trend
net = sum((pts[i + 1][0] - pts[i][0]) * (pts[i + 1][1] + pts[i][1]) / 2 for i in range(len(pts) - 1))
tot = sum((pts[i + 1][0] - pts[i][0]) * (abs(pts[i + 1][1]) + abs(pts[i][1])) / 2 for i in range(len(pts) - 1))
print(f"net area = {net:.3f}, total area = {tot:.3f}, ratio = {abs(net) / tot * 100:.0f} %")

# Relative volatility of ethanol to water
for x1, y1, T in (data[1], data[8], data[12]):
    alpha = (y1 / x1) / ((1 - y1) / (1 - x1))
print(f"x1 = {x1:.4f}: relative volatility = {alpha:.2f}")x1 T g1 g2 ln(g1/g2) GE/RT 0.0190 95.50 4.688 0.996 1.549 0.0257 0.0721 89.00 3.581 0.990 1.286 0.0824 0.0966 86.70 3.275 1.023 1.164 0.1351 0.1238 85.30 2.897 1.049 1.016 0.1734 0.1661 84.10 2.446 1.071 0.825 0.2060 0.2337 82.70 1.963 1.143 0.541 0.2601 0.3273 81.50 1.571 1.252 0.227 0.2990 0.3965 80.70 1.406 1.339 0.049 0.3112 0.5079 79.80 1.219 1.509 -0.213 0.3030 0.5732 79.30 1.148 1.632 -0.352 0.2883 0.6763 78.74 1.074 1.823 -0.529 0.2426 0.7472 78.41 1.042 1.977 -0.640 0.2031 0.8943 78.15 1.007 2.312 -0.831 0.0946 net area = -0.019, total area = 0.625, ratio = 3 % x1 = 0.0721: relative volatility = 8.20 x1 = 0.5079: relative volatility = 1.85 x1 = 0.8943: relative volatility = 1.00
What the data show
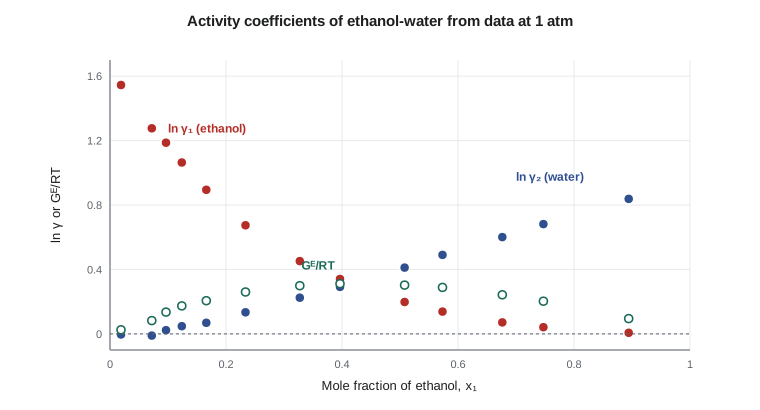
Both activity coefficients are greater than 1 almost everywhere: ethanol-water shows a strong positive deviation. Ethanol is the more non-ideal component, with \(\gamma_1 = 4.7\) at \(x_1 = 0.019\) and an infinite-dilution value of about 5. A few ethanol molecules in a large amount of water escape about five times as readily as Raoult's law expects. Water reaches \(\gamma_2 = 2.3\) near the azeotrope. Two points near the water-rich end show \(\gamma_2\) slightly below 1, which is within the scatter of the data. The excess Gibbs energy \(G^E/RT\) peaks at about 0.31 near \(x_1 = 0.4\), a moderate value. Mixtures with a peak above about 0.5 to 0.7 can split into two liquid phases, as lesson 10 shows for ethyl acetate and water.
The relative volatility of ethanol to water is 8.2 at \(x_1 = 0.072\), which is why the bottom of the rectifier separates easily, 1.85 at \(x_1 = 0.51\), and 1.00 at \(x_1 = 0.894\). A relative volatility of 1 means the vapor and liquid have the same composition: no tray can make further progress, and the column is pinched at the azeotrope. Raoult's law alone, with \(\alpha = P_1^{\text{sat}}/P_2^{\text{sat}}\) between about 2.2 and 2.3 across the range, predicts neither the easy separation at the bottom nor the pinch at the top.
Worked problem
An activity coefficient from one data point
At 1 atm, a liquid with \(x_1 = 0.2337\) ethanol boils at 82.7 °C, and the vapor holds \(y_1 = 0.5445\). Find \(\gamma_1\) and \(\gamma_2\).
Show solution
- Antoine: \(P_1^{\text{sat}} = 120.3\) kPa and \(P_2^{\text{sat}} = 52.7\) kPa at 82.7 °C.
- \(\gamma_1 = 0.5445 \times 101.3/(0.2337 \times 120.3) = 1.96\).
- \(\gamma_2 = 0.4555 \times 101.3/(0.7663 \times 52.7) = 1.14\).
Answer: Ethanol escapes about twice as readily as Raoult's law predicts at this composition.
Testing data for thermodynamic consistency
Measured vapor-liquid data contain errors in temperature, pressure and both compositions, and the Gibbs-Duhem equation gives a way to catch them. Integrating \(x_1\,d\ln\gamma_1 + x_2\,d\ln\gamma_2 = 0\) from \(x_1 = 0\) to 1 at constant temperature gives the Redlich-Kister area test:
The plot of \(\ln(\gamma_1/\gamma_2)\) against \(x_1\) should enclose equal areas above and below the axis. For isobaric data, where the temperature changes along the curve, the integral is not exactly zero, and a small residual is accepted. The ethanol-water set gives a net area of about 3 % of the total, which passes the usual screen for isobaric data. The test is necessary rather than sufficient: data can pass it and still contain compensating errors. More detailed point-by-point tests, such as the Van Ness method, compare measured vapor compositions with those predicted from a fitted model, and evaluated databanks apply such tests before a data set is recommended.
Where activity coefficients come from in practice
Activity coefficients are measured, not derived from first principles, and the main sources are vapor-liquid data such as these, infinite-dilution measurements by gas chromatography or ebulliometry, and liquid-liquid solubility data. Large evaluated collections, such as the DECHEMA Chemistry Data Series and the Dortmund Data Bank, hold many thousands of binary data sets. When a system has never been measured, group-contribution methods such as UNIFAC estimate activity coefficients from the chemical groups in the molecules, which lesson 7 describes. Dev's lab can measure a few points for an unusual mixture in a day with a small recirculating still, and Theo notes that this is cheaper than a column that does not work.
Activity on other scales
The activity coefficient in this lesson uses the pure liquid at the system temperature as its standard state, the convention natural for components that are liquids. For dissolved gases and for solids dissolved in liquids, other conventions are used: the Henry's law standard state, in which \(\gamma_i^* \to 1\) as \(x_i \to 0\), and molality-based scales for electrolytes. Each convention gives a different numerical activity coefficient for the same physical state, but consistent calculations give the same equilibrium. Lesson 10 uses the pure-component convention for liquid-liquid equilibrium.
Activity coefficients and the column
The practical value of activity coefficients shows up in the number of stages a column needs. Theo runs a quick comparison. Separating a 10 mol % ethanol feed into 80 mol % overhead and almost pure water at the bottom needs, with Raoult's law and a constant relative volatility of about 2.3, about ten theoretical stages at total reflux by the Fenske equation. With the measured activity coefficients, the bottom section separates much more easily, because the relative volatility there is about 8, and the top section much less easily, because it falls toward 1 as the composition approaches the azeotrope. The real column has a few stages doing most of the work at the bottom and many stages crawling toward 80 % near the top. A design based on Raoult's law would get the stage count wrong in both sections and would never reveal the azeotrope barrier. CHE-350 builds stage-by-stage designs on exactly these data.
Negative deviations and what they mean
Not every mixture shows positive deviations. When unlike molecules attract each other more strongly than like ones, activity coefficients fall below 1 and partial pressures fall below Raoult's law. Acetone with chloroform is the textbook case: the hydrogen on chloroform bonds to the oxygen of acetone, and the mixture boils above both pure components at some compositions. Water with strong acids such as nitric or hydrochloric acid behaves the same way. In the ethyl acetate line, acetic acid with water shows only small deviations, while acetic acid in the vapor forms dimers, a different kind of non-ideality that lesson 12 mentions. Knowing the sign of the deviation tells the engineer what kind of azeotrope, if any, to expect.
A useful way to picture the sign is through the excess Gibbs energy. Positive \(G^E\) means the mixture is less stable than an ideal solution: the molecules would rather be with their own kind, and if \(G^E\) is large enough they separate into two liquids, as lesson 10 shows. Negative \(G^E\) means the mixture is more stable than ideal and never splits. Ethanol-water, with \(G^E/RT\) peaking at 0.31, sits comfortably in the miscible range despite its strong positive deviations.
Common mistakes
MistakeComputing \(\gamma\) with the vapor pressure at a fixed reference temperature.
InsteadUse \(P^{\text{sat}}\) at each point's measured temperature.
MistakeAssuming \(\gamma < 1\) points near a pure end are physical.
InsteadValues slightly below 1 near the pure end are often within data scatter.
MistakeTreating a passed area test as proof the data are right.
InsteadIt is necessary but not sufficient; compensating errors can pass.
MistakeUsing a relative volatility from pure-component vapor pressures for a non-ideal mixture.
InsteadInclude the activity coefficients: \(\alpha_{12} = \gamma_1P_1^{\text{sat}}/(\gamma_2P_2^{\text{sat}})\).
Summary and key terms
- For a real liquid, \(\hat{f}_i = x_i\gamma_if_i\); the activity is \(a_i = x_i\gamma_i\).
- \(RT\ln\gamma_i\) is the partial molar excess Gibbs energy, and \(G^E/RT = \sum x_i\ln\gamma_i\).
- Modified Raoult's law \(y_iP = x_i\gamma_iP_i^{\text{sat}}\) handles most low-pressure equilibrium.
- Ethanol-water shows positive deviations; \(\gamma_1^\infty \approx 5\) and \(\gamma_2\) reaches about 2.3.
- The relative volatility falls from about 8 at low ethanol to 1 at the azeotrope.
- The Gibbs-Duhem area test screens data for consistency.
- Activity coefficient
- γ_i, the factor by which a component’s fugacity in a liquid differs from its ideal-solution value.
- Activity
- a_i = x_iγ_i, the effective mole fraction of a component in a non-ideal solution.
- Modified Raoult's law
- y_iP = x_iγ_iP_i^sat, vapor-liquid equilibrium with a non-ideal liquid and ideal-gas vapor.
- Positive deviation
- Activity coefficients greater than 1, giving higher partial pressures than Raoult’s law.
- Infinite-dilution activity coefficient
- γ_i^∞, the limit of γ_i as x_i goes to zero.
- Thermodynamic consistency
- Agreement of measured data with the Gibbs-Duhem equation.
- Area test
- The check that ∫ ln(γ1/γ2) dx1 from 0 to 1 is close to zero.
Practice problems
Work each problem on paper first, then reveal the answer to check.
At 79.8 °C, \(x_1 = 0.5079\) and \(y_1 = 0.6564\) at 1 atm. With \(P_1^{\text{sat}} = 107.4\) kPa, find \(\gamma_1\).
Show answer
\(0.6564 \times 101.3/(0.5079 \times 107.4) = 1.22\).
If \(\gamma_1 = 1.22\) and \(\gamma_2 = 1.51\) at \(x_1 = 0.508\), what is \(G^E/RT\)?
Show answer
\(0.508\ln 1.22 + 0.492\ln 1.51 = 0.304\).
What does \(\alpha_{12} = 1\) mean for a distillation column?
Show answer
Vapor and liquid have the same composition; the column pinches.
Why does the area test need \(\ln\gamma_1\) and \(\ln\gamma_2\) across the whole range?
Show answer
It integrates the Gibbs-Duhem relation from \(x_1 = 0\) to 1.
Is ethanol-water a positive or negative deviation system?
Show answer
Positive: both \(\gamma\) values exceed 1.
Name two sources of activity coefficient data.
Show answer
Vapor-liquid equilibrium measurements and evaluated databanks such as DECHEMA; also infinite-dilution measurements.
Lesson quiz · 5 questions
Score 60% or more to complete this lesson.
Create a free account to save your progress, take quizzes and earn a certificate.