
BUS-120 · Lesson 8 of 12 · 27 min
Visual communication and accessibility
Business readers increasingly expect information to be visual: dashboards instead of tables of numbers, charts in reports, infographics in newsletters, icons and screenshots in instructions. Well-designed visuals help readers see patterns, compare values and follow processes far faster than text alone. Poorly designed visuals confuse or mislead, and visuals that ignore accessibility shut out readers with disabilities. This lesson covers document design, choosing and designing charts, avoiding misleading visuals, and making documents and digital content accessible under the Web Content Accessibility Guidelines (WCAG) and the accessibility laws of Canada and the United States.
Document design basics
Readers judge a document by its appearance before they read a word. A few principles make documents easier to scan and use. Use white space generously: margins, space between paragraphs and short line lengths (about 50 to 75 characters) make text less intimidating. Create a clear hierarchy with consistent heading levels, so readers can see the structure at a glance. Choose readable fonts, usually a sans serif such as Arial, Calibri or Verdana for screens, at 11 or 12 points for body text, and avoid setting long passages in capitals, italics or underlining. Align text left with a ragged right edge, which is easier to read than full justification. Use lists for steps and parallel items, and tables for comparisons. Above all, be consistent: the same kind of element should always look the same.
Choosing the right visual
Each kind of visual suits particular tasks. Choose by asking what the reader needs to see.
| Reader needs to see | Best visual | Notes |
|---|---|---|
| Exact values to look up | Table | Use when readers need precise figures, not patterns |
| Comparison across categories | Bar chart (horizontal for long labels) | Start the value axis at zero; sort bars by value |
| Change over time | Line chart | Use for continuous data; limit to about four lines |
| Parts of a whole | Stacked bar or, for two to four parts, a pie chart | Pie charts are hard to read with many slices or similar sizes |
| Relationship between two variables | Scatter plot | Add a trend line if relevant |
| A process or sequence | Flow chart | Use consistent shapes and one direction of flow |
| A schedule | Gantt chart | Shows tasks, durations and dependencies |
| Organization or hierarchy | Organization chart or tree diagram | Keep levels aligned |
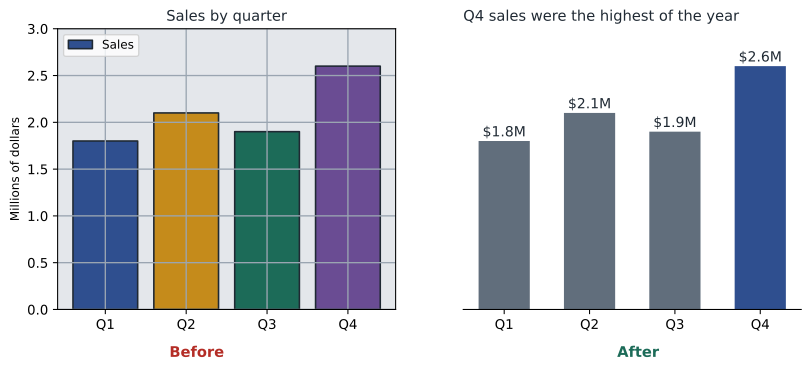
Every visual in a report should be numbered, titled and introduced in the text before it appears ("As Figure 3 shows, returns peak in January"). Give charts informative titles that state the takeaway ("Online sales overtook store sales in 2025") rather than labels ("Sales by channel"). Label axes and units, cite the data source below the visual and remove anything that does not help the reader: heavy gridlines, 3-D effects, decorative backgrounds and redundant legends. The designer Edward Tufte called these extras chartjunk and urged designers to maximize the share of ink devoted to data.
Misleading visuals
Visuals can mislead, whether deliberately or by accident. Common problems include a truncated value axis that exaggerates differences, uneven intervals on the time axis, 3-D effects that distort area, pictograms whose area grows with the square of the value, cherry-picked time periods, and dual axes scaled to suggest a relationship that does not exist. Tufte proposed the lie factor to measure distortion: the size of the effect shown in the graphic divided by the size of the effect in the data. A value near 1 is honest.
Worked problem
Measuring distortion from a truncated axis
A bar chart compares customer satisfaction scores of 82 (last year) and 86 (this year). The value axis starts at 80. How large does the change appear, how large is it really and what is the lie factor?
Show solution
- Real change = (86 − 82) ÷ 82 = 4.9 %.
- Visible bar heights above the axis start: 82 − 80 = 2 units and 86 − 80 = 6 units.
- Apparent change = (6 − 2) ÷ 2 = 200 %, so the second bar looks three times as tall.
- Lie factor = 200 % ÷ 4.9 % ≈ 41.
Answer: The chart makes a 4.9 % improvement look like a 200 % jump, a lie factor of about 41. Start bar charts at zero, or use a line or dot chart with a clearly labeled axis if small differences matter.
Accessibility: why it matters
About one in four Canadians aged 15 and over reported at least one disability in Statistics Canada's 2022 Canadian Survey on Disability, and in the United States the Centers for Disease Control and Prevention estimates that more than one in four adults has a disability. Disabilities that affect how people use documents include blindness and low vision (many people use screen readers or magnification), color vision deficiency (about 1 in 12 men and 1 in 200 women), deafness and hearing loss, motor disabilities that make a mouse hard to use, and cognitive and learning disabilities. Accessible communication also helps everyone else: captions help people in noisy places, clear structure helps skimmers, and good contrast helps anyone reading a phone in sunlight.
The Web Content Accessibility Guidelines
The Web Content Accessibility Guidelines (WCAG), published by the World Wide Web Consortium (W3C), are the international benchmark for accessible digital content. WCAG is organized around four principles, summarized by the acronym POUR: content must be perceivable, operable, understandable and robust. Each guideline has testable success criteria at three levels: A (minimum), AA (the level most laws and policies require) and AAA (enhanced). WCAG 2.2, published in October 2023, added nine success criteria to WCAG 2.1, including focus not obscured (keyboard focus must not be hidden behind sticky headers), target size minimum (clickable targets at least 24 by 24 CSS pixels, with exceptions), accessible authentication (no puzzles or memory tests to log in without an alternative) and redundant entry (do not make users re-enter information they have already given). It also removed the old criterion on parsing, which modern browsers made unnecessary.
| Principle | Meaning | Examples of success criteria |
|---|---|---|
| Perceivable | Users can perceive the content with at least one sense | Text alternatives for images; captions; contrast of at least 4.5:1 for normal text |
| Operable | Users can operate the interface | Everything works by keyboard; no content flashes more than three times a second; focus not obscured |
| Understandable | Users can understand content and operation | Page language identified; consistent navigation; clear error messages and labels |
| Robust | Content works with current and future assistive technologies | Name, role and value of controls exposed to screen readers |
Accessible documents in practice
You do not need to be a web developer to make documents accessible. Most of the work happens as you write in a word processor, presentation tool or email program.
- Use built-in heading styles (Heading 1, Heading 2) rather than bold text, so screen reader users can navigate by heading.
- Write alternative text (alt text) for meaningful images that conveys the information or purpose of the image; mark decorative images as decorative.
- Use meaningful link text ("Download the 2026 benefits guide") rather than "click here".
- Ensure sufficient contrast and never use color alone to convey meaning; add labels, patterns or symbols.
- Use real tables with header rows for data, and avoid merged cells and tables used only for layout.
- Caption videos and provide transcripts for audio.
- Use the accessibility checker built into Microsoft Office, Google Workspace or Adobe Acrobat before sharing, and tag PDFs.
- Write in plain language (lesson 2): it is itself an accessibility practice, especially for people with cognitive disabilities.
Measuring color contrast
WCAG defines contrast using the relative luminance of the two colors, a measure of brightness from 0 (black) to 1 (white). Normal text needs a contrast ratio of at least 4.5:1 at level AA, and large text (at least 18 point, or 14 point bold) at least 3:1. Interface components and meaningful graphics, such as chart lines, also need at least 3:1 against adjacent colors.
Worked problem
Checking gray text on white
A designer proposes light gray text with the hexadecimal color #999999 on a white background for a report's body text. Does it meet WCAG AA? If not, does #767676 pass?
Show solution
- For #999999, each channel is 153 ÷ 255 = 0.600. Linearized: ((0.600 + 0.055) ÷ 1.055)^2.4 = 0.621^2.4 ≈ 0.319. Because R, G and B are equal, L ≈ 0.319.
- White has L = 1. Contrast = (1 + 0.05) ÷ (0.319 + 0.05) = 1.05 ÷ 0.369 ≈ 2.85:1, below 4.5:1, so it fails for normal text (and even for large text).
- For #767676, each channel is 118 ÷ 255 = 0.463. Linearized: ((0.463 + 0.055) ÷ 1.055)^2.4 = 0.491^2.4 ≈ 0.181.
- Contrast = 1.05 ÷ (0.181 + 0.05) = 1.05 ÷ 0.231 ≈ 4.54:1, which passes AA for normal text.
Answer: #999999 fails at 2.85:1; #767676 passes at 4.54:1. It is the lightest gray that passes AA on white, which is why designers often remember it.
def channel(v):
    c = v / 255
    return c / 12.92 if c <= 0.04045 else ((c + 0.055) / 1.055) ** 2.4

def luminance(hex_colour):
    r, g, b = (int(hex_colour[i:i + 2], 16) for i in (1, 3, 5))
    return 0.2126 * channel(r) + 0.7152 * channel(g) + 0.0722 * channel(b)

def contrast(a, b):
    hi, lo = sorted([luminance(a), luminance(b)], reverse=True)
    return (hi + 0.05) / (lo + 0.05)

for fg in ["#999999", "#767676", "#2F4F8F", "#C58B1B"]:
    ratio = contrast(fg, "#FFFFFF")
    verdict = "passes AA" if ratio >= 4.5 else ("large text only" if ratio >= 3 else "fails")
print(f"{fg} on white: {ratio:.2f}:1 {verdict}")#999999 on white: 2.85:1 fails #767676 on white: 4.54:1 passes AA #2F4F8F on white: 7.97:1 passes AA #C58B1B on white: 2.96:1 fails
Accessibility law: Canada and the United States
In the United States, the Americans with Disabilities Act (ADA, 1990) prohibits disability discrimination. Title III covers businesses open to the public, and courts and the Department of Justice have treated websites as within its scope, although no technical standard is written into the regulation; WCAG 2.1 AA is the usual benchmark in settlements and lawsuits. In April 2024, the Department of Justice adopted a rule under Title II requiring state and local governments to make web content and mobile apps conform to WCAG 2.1 Level AA; in 2026 the compliance dates were extended by one year, to April 26, 2027, for entities serving 50,000 people or more and to April 26, 2028, for smaller entities and special districts. Section 508 of the Rehabilitation Act requires federal agencies to make their information and communication technology accessible, using standards that incorporate WCAG 2.0 AA. Several states have their own accessibility laws.
| Element | Canada | United States |
|---|---|---|
| Federal private-sector law | Accessible Canada Act (federally regulated organizations) | ADA Title III (businesses open to the public) |
| Government websites | Treasury Board Standard on Web Accessibility; ACA | Section 508 (federal agencies); ADA Title II rule (state and local governments) |
| Provincial or state law | AODA (Ontario) and acts in other provinces | State laws such as California's Unruh Civil Rights Act |
| Technical benchmark | WCAG 2.0 AA (AODA); CAN/ASC-EN 301 549 (federal standard) | WCAG 2.1 AA (Title II rule); WCAG 2.0 AA (Section 508) |
| Accommodation duty | Human rights codes | ADA reasonable accommodation and effective communication |
Whatever the jurisdiction, aiming for WCAG 2.2 Level AA is a sound practical target: it meets or exceeds the older versions that laws cite, and it reflects current best practice.
Portfolio task for lesson 8: take a report or slide deck you have produced and run the built-in accessibility checker. Fix every issue, add alt text to each image, check the contrast of your colors and redesign one chart using a takeaway title and direct labels. Record the before-and-after issue count.
Common mistakes
MistakeStarting a bar chart's value axis above zero.
InsteadStart bar charts at zero; use a line or dot chart with a labeled axis if small differences matter.
MistakeUsing color alone to show which bars or lines are which.
InsteadAdd direct labels, patterns or symbols as well as color.
MistakeWriting "image" or the file name as alt text.
InsteadDescribe the information or purpose of the image; mark decorative images as decorative.
MistakeFormatting headings by making text bold and larger.
InsteadUse built-in heading styles so screen readers can navigate.
MistakeUsing light gray text for a clean look.
InsteadCheck contrast: normal text needs at least 4.5:1.
MistakeGiving a chart a label such as "Sales by quarter".
InsteadUse a takeaway title such as "Sales rose in every quarter of 2026".
Summary and key terms
- Design documents with white space, a clear hierarchy, readable fonts, left alignment and consistency.
- Match the visual to the reader's task: tables for exact values, bars for comparisons, lines for trends.
- Number, title and introduce every visual; use takeaway titles and remove chartjunk.
- Avoid truncated axes, distorted areas and other misleading techniques; the lie factor measures distortion.
- WCAG's principles are perceivable, operable, understandable and robust; level AA is the usual target, and WCAG 2.2 is current.
- Normal text needs a contrast ratio of at least 4.5:1, and large text 3:1.
- In the United States, the ADA and Section 508 set accessibility duties, and a 2024 Title II rule requires WCAG 2.1 AA for state and local governments.
- White space
- Empty space around and between elements that makes a document easier to read.
- Takeaway title
- A chart title that states the main message of the chart.
- Chartjunk
- Decorative elements in a chart that do not convey data.
- Lie factor
- The size of an effect shown in a graphic divided by its size in the data.
- WCAG
- Web Content Accessibility Guidelines, the international standard for accessible digital content.
- POUR
- The four WCAG principles: perceivable, operable, understandable and robust.
- Alt text
- A text alternative that conveys the content or purpose of an image.
- Screen reader
- Software that reads digital content aloud or sends it to a braille display.
- Contrast ratio
- A measure of the difference in luminance between two colors, from 1:1 to 21:1.
- Relative luminance
- The brightness of a color on a scale from 0 for black to 1 for white.
Practice problems
Work each problem on paper first, then reveal the answer to check.
Which visual best shows monthly website visits over two years?
Show answer
A line chart.
Rewrite the chart title "Turnover by department" as a takeaway title.
Show answer
For example, "Turnover in the warehouse is twice the company average".
A chart shows values of 50 and 55 on an axis starting at 45. What is the apparent change and the real change?
Show answer
Apparent: (10 − 5) ÷ 5 = 100 %; real: 5 ÷ 50 = 10 %; lie factor 10.
What does POUR stand for?
Show answer
Perceivable, operable, understandable, robust.
What minimum contrast ratio does WCAG AA require for normal text?
Show answer
4.5:1.
Two colors have luminances of 0.70 and 0.10. What is their contrast ratio?
Show answer
(0.70 + 0.05) ÷ (0.10 + 0.05) = 5.0:1.
Write alt text for a bar chart showing that sales rose from $2 million to $3 million between 2024 and 2026.
Show answer
For example, "Bar chart: annual sales rose from $2 million in 2024 to $3 million in 2026."
Name two criteria added in WCAG 2.2.
Show answer
Focus not obscured, target size minimum, accessible authentication, redundant entry, dragging movements, consistent help (any two).
Which US rule requires state and local government websites to meet WCAG 2.1 AA?
Show answer
The Department of Justice's 2024 rule under Title II of the ADA.
Why is "click here" poor link text?
Show answer
Screen reader users often navigate by links alone, and "click here" does not say where the link goes.
Lesson quiz · 5 questions
Score 60% or more to complete this lesson.
Create a free account to save your progress, take quizzes and earn a certificate.