
BUS-101 · Lesson 9 of 12 · 28 min
Accounting and reading financial statements and the 10-K
Accounting is often called the language of business. It records, summarizes and reports the financial activity of an organization so that owners, managers, lenders, investors, tax authorities and others can make decisions. You do not need to be an accountant to run or work in a business, but you do need to read the three main financial statements, understand how they connect and calculate a few key ratios. This lesson covers who uses accounting information, the accounting equation, the balance sheet, income statement and cash flow statement, accrual accounting, financial ratios and where to find public companies' reports.
Users and types of accounting
Financial accounting produces reports for people outside the business, such as investors, lenders, suppliers and regulators, following a set of standard rules so that statements are comparable. Managerial (management) accounting produces information for people inside the business, such as budgets, product costs and performance reports, in whatever form is most useful. Tax accounting prepares returns under tax law, which often differs from financial reporting rules. Auditors are independent accountants who examine financial statements and give an opinion on whether they are presented fairly.
In the United States, the professional designation for public accountants is the Certified Public Accountant (CPA), licensed by each state. Public companies report under US generally accepted accounting principles (US GAAP), set by the Financial Accounting Standards Board (FASB), and their audits are overseen by the Public Company Accounting Oversight Board (PCAOB), created by the Sarbanes-Oxley Act of 2002. Foreign companies listed in the United States may report under International Financial Reporting Standards (IFRS).
The accounting equation
Everything in financial accounting rests on one equation. What a business owns (its assets) must have been financed either by borrowing (liabilities) or by owners (equity).
Assets are resources the business controls that are expected to bring future benefits, such as cash, accounts receivable (money customers owe), inventory, equipment and buildings. Liabilities are obligations to others, such as accounts payable (money owed to suppliers), wages payable, loans and bonds. Equity is the owners' residual claim: what would be left for them if all assets were sold at book value and all liabilities paid. Equity grows when owners invest more and when the business earns profits it keeps (retained earnings); it shrinks with losses and with dividends or owner withdrawals.
Every transaction keeps the equation in balance. This is the basis of double-entry bookkeeping, in which every transaction affects at least two accounts with equal debits and credits.
Worked problem
Transactions and the accounting equation
Maya starts a landscaping business. (1) She invests $30,000 of her savings. (2) The business borrows $20,000 from a bank. (3) It buys a truck for $35,000 cash. (4) It does a job for $4,000 and the customer will pay next month. (5) It pays $1,500 for fuel and wages. Show the accounting equation after each step.
Show solution
- (1) Cash +$30,000; equity +$30,000. Assets $30,000 = Liabilities $0 + Equity $30,000.
- (2) Cash +$20,000; loan +$20,000. Assets $50,000 = $20,000 + $30,000.
- (3) Cash −$35,000; truck +$35,000. Assets still $50,000 = $20,000 + $30,000.
- (4) Accounts receivable +$4,000; equity +$4,000 (revenue). Assets $54,000 = $20,000 + $34,000.
- (5) Cash −$1,500; equity −$1,500 (expenses). Assets $52,500 = $20,000 + $32,500.
Answer: After five transactions the business has assets of $52,500 (cash $13,500, receivable $4,000, truck $35,000), liabilities of $20,000 and equity of $32,500. The equation balances after every step, and the $2,500 profit has raised equity.
The balance sheet
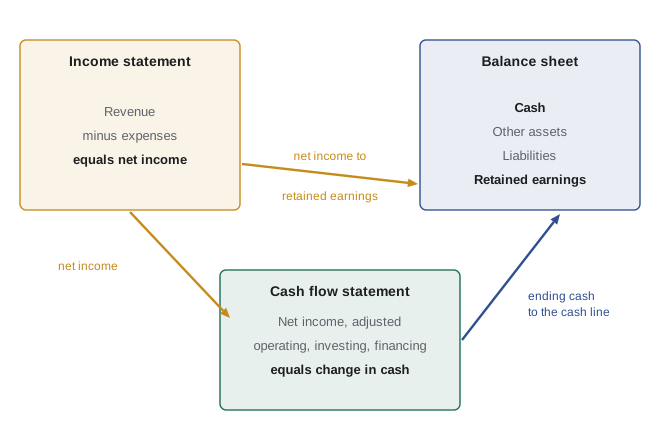
The balance sheet shows assets, liabilities and equity at a single moment, such as December 31. It is a snapshot. Assets and liabilities are split into current items, expected to be turned into cash or paid within a year, and non-current or long-term items. Under US GAAP, current assets are usually listed first, in order of liquidity.
| Assets | $ | Liabilities and equity | $ |
|---|---|---|---|
| Cash | 60,000 | Accounts payable | 70,000 |
| Accounts receivable | 90,000 | Current portion of loan | 30,000 |
| Inventory | 150,000 | Total current liabilities | 100,000 |
| Total current assets | 300,000 | Long-term loan | 200,000 |
| Equipment and buildings (net) | 500,000 | Total liabilities | 300,000 |
| Share capital | 200,000 | ||
| Retained earnings | 300,000 | ||
| Total assets | 800,000 | Total liabilities and equity | 800,000 |
The income statement
The income statement, also called the statement of operations or statement of earnings, shows revenue and expenses over a period, such as a year or a quarter. It is like a video rather than a snapshot. The basic structure is: revenue minus cost of goods sold equals gross profit; minus operating expenses (selling, general and administrative, and depreciation) equals operating income; minus interest and income taxes equals net income. Public companies also report earnings per share.
| Line | $ |
|---|---|
| Revenue | 1,200,000 |
| Cost of goods sold | (720,000) |
| Gross profit | 480,000 |
| Selling, general and administrative expenses | (290,000) |
| Depreciation | (50,000) |
| Operating income | 140,000 |
| Interest expense | (16,000) |
| Income before tax | 124,000 |
| Income tax | (31,000) |
| Net income | 93,000 |
Accrual accounting
Financial statements are prepared on the accrual basis. Revenue is recorded when it is earned, typically when goods are delivered or services performed, not when cash is received, and expenses are recorded in the period they help produce revenue, not when they are paid. Depreciation spreads the cost of long-lived assets such as equipment over their useful lives. Accrual accounting gives a better picture of performance than counting cash, but it means profit and cash flow can differ widely in any period. A business that sells on credit, builds inventory or buys equipment may report a profit and still run short of cash.
The cash flow statement
The cash flow statement explains how cash changed during the period, in three sections. Operating activities show cash from running the business: net income adjusted for non-cash items such as depreciation and for changes in working capital such as receivables, inventory and payables. Investing activities show cash spent on or received from long-term assets, such as buying equipment or selling a building. Financing activities show cash from or to lenders and owners: borrowing, repaying loans, issuing shares and paying dividends. Many analysts watch free cash flow, operating cash flow minus capital spending, as a measure of cash the business generates for its owners.
Worked problem
Profit versus cash
A wholesaler reports net income of $93,000 for the year, including $50,000 of depreciation. During the year, accounts receivable rose by $40,000, inventory rose by $60,000 and accounts payable rose by $15,000. It spent $80,000 on new equipment and repaid $30,000 of its loan. What was its cash flow from operations and its change in cash?
Show solution
- Start with net income: $93,000.
- Add back depreciation (a non-cash expense): +$50,000 → $143,000.
- Rise in receivables uses cash: −$40,000; rise in inventory uses cash: −$60,000; rise in payables provides cash: +$15,000.
- Cash from operations = $143,000 − $40,000 − $60,000 + $15,000 = $58,000.
- Change in cash = $58,000 − $80,000 (investing) − $30,000 (financing) = −$52,000.
Answer: Despite $93,000 of profit, cash from operations was only $58,000, and cash fell by $52,000 overall because the business invested in receivables, inventory and equipment and repaid debt.
Financial ratios
Ratios turn raw numbers into measures that can be compared across years and with competitors. Four families are common:
- Liquidity ratios measure the ability to pay short-term obligations. Current ratio = current assets ÷ current liabilities. Quick ratio = (current assets − inventory) ÷ current liabilities.
- Profitability ratios measure how well the business earns profits. Gross margin = gross profit ÷ revenue; net margin = net income ÷ revenue; return on equity (ROE) = net income ÷ equity.
- Leverage ratios measure reliance on debt. Debt-to-equity = total liabilities ÷ equity.
- Efficiency or activity ratios measure how well assets are used, such as inventory turnover and days sales outstanding.
Worked problem
Ratio analysis of Northfield Supply
Using the balance sheet and income statement for Northfield Supply above, calculate the current ratio, quick ratio, gross margin, net margin, debt-to-equity and return on equity, and comment.
Show solution
- Current ratio = $300,000 ÷ $100,000 = 3.0.
- Quick ratio = ($300,000 − $150,000) ÷ $100,000 = 1.5.
- Gross margin = $480,000 ÷ $1,200,000 = 40 %; net margin = $93,000 ÷ $1,200,000 = 7.75 %.
- Equity = $200,000 + $300,000 = $500,000; debt-to-equity = $300,000 ÷ $500,000 = 0.6.
- Return on equity = $93,000 ÷ $500,000 = 18.6 %.
Answer: Northfield is liquid (current ratio 3.0), moderately leveraged (0.6) and profitable (ROE 18.6 %). A current ratio this high may even suggest too much inventory; comparison with industry peers and prior years would show whether the numbers are strong or weak.
A ratio on its own says little. It needs a benchmark: the same company's past results, a competitor or an industry average. Ratios also depend on accounting choices and can be affected by one-time items, so analysts read the notes to the statements before drawing conclusions.
Annual reports and where to find them
Public companies file an annual report on Form 10-K with the Securities and Exchange Commission (SEC). The 10-K contains a description of the business, risk factors, management's discussion and analysis (MD&A), audited financial statements, notes and the auditor's report. Quarterly reports are filed on Form 10-Q and major events on Form 8-K. All of these are free to read on the SEC's EDGAR system. Many companies also publish a glossier annual report to shareholders.
A practical way to read an annual report as a beginner is: read the letter to shareholders and MD&A for management's story; scan the income statement for revenue growth and margins; check the balance sheet for debt and liquidity; look at the cash flow statement to see whether operations generate cash; read the risk factors; and check the auditor's opinion. Then compare with the story management tells.
Budgets and managerial accounting
Managerial accounting supports decisions inside the firm. Budgets set financial targets for the year; variance reports compare actual results with the budget so managers can investigate the differences; and cost accounting works out what each product, service or customer really costs, including a fair share of overhead. A product that looks profitable when only its direct materials and labor are counted may lose money once the setup time, customer support and warehouse space it consumes are included. Contribution margin analysis, which you met in the break-even lesson, is another managerial accounting tool, used to decide which products to promote, which to drop and whether to accept a special order at a reduced price.
Small business owners do not need to keep books by hand. Cloud accounting software links to bank accounts, issues invoices, tracks expenses and produces statements automatically, but the owner still needs to read the results each month and act on what they show.
Financial statements also have limits. They use historical cost for many assets, so a building bought decades ago may appear far below its market value; they leave out valuable intangible assets that a company built itself, such as its brand, customer relationships and the skills of its people; and they involve estimates, such as the useful lives of equipment and the share of receivables that will never be collected. Occasionally managers manipulate these estimates to flatter results, which is one reason independent audits, audit committees and strong internal controls exist. Reading statements critically, alongside the notes and the MD&A, protects you from taking reported numbers at face value.
Common mistakes
MistakeThinking profit equals cash.
InsteadRead the cash flow statement; receivables, inventory and capital spending absorb cash.
MistakeTreating the balance sheet as covering a period.
InsteadThe balance sheet is at a point in time; the income and cash flow statements cover a period.
MistakeJudging a ratio without a benchmark.
InsteadCompare with past years, competitors or industry averages.
MistakeForgetting that depreciation is a non-cash expense.
InsteadAdd depreciation back when moving from net income to operating cash flow.
MistakeSkipping the notes and the MD&A.
InsteadRead them for accounting choices, one-time items and management's explanation.
Summary and key terms
- Financial accounting reports to outsiders; managerial accounting serves insiders.
- Assets = liabilities + owners' equity after every transaction.
- The balance sheet is a snapshot; the income statement and cash flow statement cover a period.
- Accrual accounting records revenue when earned and expenses when incurred.
- Cash flows are grouped into operating, investing and financing activities.
- Key ratios include the current ratio, gross and net margin, debt-to-equity and ROE.
- US public companies report under US GAAP and file the 10-K on EDGAR.
- Asset
- A resource controlled by the business that brings future benefits.
- Liability
- An obligation owed to others.
- Owners' equity
- The owners' residual claim on assets after liabilities.
- Accrual basis
- Recording revenue when earned and expenses when incurred.
- Depreciation
- Spreading the cost of a long-lived asset over its useful life.
- Current ratio
- Current assets divided by current liabilities.
- Return on equity
- Net income divided by owners' equity.
- US GAAP
- Generally accepted accounting principles set by the FASB for US companies.
- Form 10-K
- The annual report a US public company files with the SEC.
- EDGAR
- The SEC's online system for public company filings.
Practice problems
Work each problem on paper first, then reveal the answer to check.
Assets $500,000, liabilities $320,000. Equity?
Show answer
$180,000.
A business buys equipment for cash. What happens to total assets?
Show answer
No change: cash falls and equipment rises by the same amount.
Revenue $800,000, COGS $500,000. Gross margin?
Show answer
37.5 %.
Current assets $240,000, current liabilities $160,000. Current ratio?
Show answer
1.5.
Net income $60,000, equity $400,000. ROE?
Show answer
15 %.
Which statement is a snapshot at a point in time?
Show answer
The balance sheet.
Is buying a building an operating, investing or financing cash flow?
Show answer
Investing.
Net income $50,000, depreciation $20,000, receivables up $15,000. Operating cash flow (ignoring other items)?
Show answer
$55,000.
Where can you read a US public company's 10-K?
Show answer
On the SEC's EDGAR system.
Liabilities $300,000, equity $600,000. Debt-to-equity?
Show answer
0.5.
Lesson quiz · 5 questions
Score 60% or more to complete this lesson.
Create a free account to save your progress, take quizzes and earn a certificate.