
AI-499 · Lesson 8 of 12 · 25 min
Rigorous evaluation: uncertainty, calibration and robustness
The evaluation report is the heart of a capstone, because it determines whether anyone should trust the system. A rigorous evaluation does more than report a single score on the test set: it states how uncertain that score is, checks whether the model's confidence can be trusted, tests behavior under conditions that differ from the training data, examines performance across important slices, and compares honestly with baselines and the current process. This lesson covers confidence intervals and test set size, statistical comparison of models, calibration, robustness and stress testing, out-of-distribution detection, human evaluation design, and how to write an evaluation section that reviewers will trust.
Uncertainty in a test score
A test score is an estimate based on a finite sample, and a different sample would give a slightly different number. For a proportion such as accuracy measured on \(n\) independent examples, the standard error is approximately:
With 400 test examples and an accuracy of 0.85, the standard error is \(\sqrt{0.85 \times 0.15 / 400} \approx 0.018\), so the 95 % confidence interval is roughly 0.81 to 0.89. A result of 0.85 on 400 examples cannot be distinguished from 0.83 or 0.87. The interval narrows only with the square root of the test set size: quadrupling the test set halves its width. For metrics that are not simple proportions, such as F1, AUC or BLEU, or when examples are grouped, the bootstrap (Lesson 5) estimates intervals without formulas. Always report intervals, or at least the test set size, with headline results.
Worked problem
How large must the test set be?
A team wants to report accuracy, expected to be about 0.90, with a 95 % confidence interval no wider than ±2 percentage points. How many independent test examples are needed?
Show solution
- Required standard error: 0.02 / 1.96 ≈ 0.0102.
- Solve \(\sqrt{0.9 \times 0.1 / n} = 0.0102\): \(n = 0.09 / 0.0102^2 \approx 865\).
- Round up and allow for slices: about 900 examples, more if slice results are also needed.
Answer: About 900 independent examples; for ±1 point, about four times as many.
Comparing two models
When comparing two models on the same test set, use paired methods, which account for the fact that both models see the same examples. The paired bootstrap of Lesson 5 is general. For accuracy, McNemar's test compares the number of examples where model A is right and B wrong with the number where B is right and A wrong; only these disagreements carry information about which model is better. When many comparisons are made, such as several models, slices and metrics, some differences will appear significant by chance, so focus on a small number of pre-planned comparisons or adjust for multiple testing. Above all, distinguish statistical significance from practical importance: a reliable 0.3-point gain may not matter to users, while a large but uncertain gain on a small, critical slice might.
Calibration
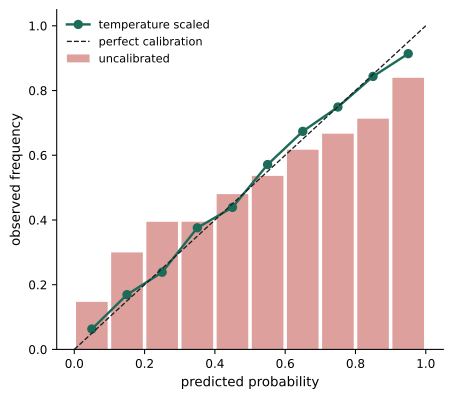
Many models output a probability or confidence score. A model is well calibrated if, among all the cases where it says 80 %, about 80 % are actually positive. Calibration matters whenever scores are used as probabilities: setting thresholds by expected cost, ranking with risk estimates, deciding when to defer to a human, or summing predicted probabilities to forecast totals. Modern neural networks are often overconfident. Calibration is assessed with a reliability diagram, which plots observed frequency against predicted probability in bins, and summarized by the expected calibration error (ECE), the average gap between confidence and accuracy, weighted by the number of examples per bin.
Simple post-hoc methods improve calibration without retraining: temperature scaling divides the model's logits by a single learned temperature, fitted on validation data; Platt scaling fits a logistic regression on the scores; and isotonic regression fits a monotonic mapping.
import numpy as np
# Calibration: expected calibration error and a temperature fix
rng = np.random.default_rng(5)
n = 4000
logits = rng.normal(0, 2.2, n)
true_p = 1 / (1 + np.exp(-logits / 2.0))          # the model is overconfident by a factor of 2
y = rng.random(n) < true_p
def ece(p, y, bins=10):
    edges = np.linspace(0, 1, bins + 1); total = 0.0
    for lo, hi in zip(edges[:-1], edges[1:]):
        m = (p >= lo) & (p < hi)
        if m.any(): total += m.mean() * abs(p[m].mean() - y[m].mean())
    return total
p_raw = 1 / (1 + np.exp(-logits))
best_t, best_nll = 1.0, np.inf
for t in np.linspace(0.5, 4, 36):
    p = np.clip(1 / (1 + np.exp(-logits / t)), 1e-6, 1 - 1e-6)
    nll = -np.mean(y * np.log(p) + (~y) * np.log(1 - p))
    if nll < best_nll: best_t, best_nll = t, nll
p_cal = 1 / (1 + np.exp(-logits / best_t))
print(f"ECE before calibration: {ece(p_raw, y):.3f}")
print(f"fitted temperature: {best_t:.1f}")
print(f"ECE after temperature scaling: {ece(p_cal, y):.3f}")ECE before calibration: 0.093 fitted temperature: 1.9 ECE after temperature scaling: 0.014
The simulated model is overconfident by a factor of about two, and its ECE is about 0.09: when it says 90 %, it is right much less often. Fitting a temperature of about 1.9 on validation data reduces ECE to about 0.01. The ranking of examples, and hence metrics such as AUC, is unchanged, because temperature scaling preserves order; only the probabilities become trustworthy.
Robustness and stress testing
A system that performs well on a test set drawn from the same distribution as its training data may still fail when conditions change. Stress testing deliberately probes these conditions:
- Perturbations: adding noise, blur, compression, rotation or lighting changes to images; typos, paraphrases, capitalization and different dialects to text; missing fields or unusual values to tabular data.
- Distribution shift: evaluating on data from a different time period, source, location or population.
- Edge cases and rare categories: deliberately collected examples of conditions the system must handle.
- Behavioral tests: checklists of input–output expectations, such as "changing a name should not change the sentiment" or "negating a statement should change the label".
- Adversarial tests: inputs crafted to cause failures, including prompt injection for LLM systems (Lessons 7 and 9).
The aim is not to make a system immune to everything but to know where it fails, so that users and the deployment design can account for it.
| Test | What it reveals | Example |
|---|---|---|
| Noise and corruption | Sensitivity to input quality | Accuracy as JPEG quality decreases |
| Temporal shift | Whether patterns hold over time | Train on 2023, test on 2025 |
| New source | Generalization to new entities | Invoices from suppliers never seen |
| Invariance test | Unwanted sensitivity | Swapping names of different genders |
| Directional test | Expected sensitivity | Adding "not" flips sentiment |
| Out-of-scope inputs | Behavior outside the task | Non-invoice documents submitted |
Out-of-distribution inputs and abstention
Real users submit inputs the system was never designed for: a photo of a cat to a crop disease classifier, a contract to an invoice extractor, a question in another language to an English assistant. A system that confidently produces an answer for such inputs is dangerous. Out-of-distribution detection methods, such as thresholds on confidence, distances in embedding space from the training data, or a separate classifier for in-scope inputs, allow the system to abstain or ask for human review. Evaluation should measure how often the system correctly flags out-of-scope inputs and how much accuracy improves on the inputs it does answer, often shown as a coverage–accuracy curve: as the system abstains on more of its least confident cases, accuracy on the remaining cases rises.
Human evaluation
Where automatic metrics are inadequate, as for open-ended generation, explanations or user experience, human evaluation is needed. Good practice includes clear rubrics with defined scales and examples; raters who represent the users or have the necessary expertise; blinding raters to which system produced each output and randomizing order; multiple raters per item with measured agreement (Lesson 3); and enough items for meaningful comparisons. Pairwise comparisons, asking which of two outputs is better, are often more reliable than absolute ratings. Studies with real users, such as timing tasks with and without the system, show actual value but need ethics review if they involve people outside the team.
Writing the evaluation section
A trustworthy evaluation section states the test data and how it was protected from leakage; reports the primary metric with confidence intervals alongside baselines and the current process; shows slice results and robustness tests; reports calibration where probabilities are used; includes error analysis with examples of typical failures; discusses limitations openly, including conditions where the system should not be used; and avoids overclaiming. Reviewers trust a report that shows the system's failures more than one that shows only its successes.
Evaluating with limited labels
When test labels are expensive, as in medical or legal applications, every labeled example counts. Strategies include stratified sampling, which ensures that important slices are represented; oversampling rare but critical cases and then reweighting to estimate overall performance; and using model disagreement or uncertainty to choose which cases experts should label, while keeping a random sample for unbiased overall estimates. Document how the test set was sampled, because it affects how results should be interpreted.
Reporting negative and null results
Not every experiment succeeds, and failed ideas are part of the evidence. A capstone report that explains which plausible approaches did not help, and why, demonstrates understanding and saves others from repeating them. When the final system does not reach its target, report the gap honestly, analyze its causes and describe what would be needed to close it. Reviewers value a clear account of a near-miss far more than inflated claims of success.
Evaluation of explanations and interfaces
If the system shows explanations, confidence scores or sources to users, evaluate them too. Do users understand them? Do they help users catch the system's errors, or do they increase over-reliance by making wrong answers look authoritative? Small user studies, in which participants complete tasks with and without explanations while their accuracy is measured, answer these questions directly.
Evaluating against the current process
The most persuasive comparison is often with the way the task is done today. If staff currently perform the task, measure their accuracy and time on the same test set, or on a sample, using the same scoring rules. Human performance is not perfect, and knowing its level sets realistic targets: a model that matches experienced staff at a fraction of the time may be very valuable, while one that exceeds a naive baseline but falls short of staff may be useful only as an assistant. Remember that people and models make different kinds of errors, so a combination, such as the model flagging cases for human review, may outperform either alone.
Pre-registering the final evaluation
To protect against unconscious bias in the final evaluation, write down before running it exactly which model will be evaluated, on which test set, with which metrics and slices, and what will count as meeting the target. This simple pre-registration, recorded in the decision log, makes the final result credible and prevents the temptation to choose favorable metrics after seeing the results.
Taken together, these practices turn a single headline number into a body of evidence: how well the system works, how sure we are, where it works less well, how far its confidence can be trusted, and how it behaves when conditions change. That evidence is what the partner and reviewers need in order to decide whether and how to use the system.
Common mistakes
MistakeReporting a score without its uncertainty.
InsteadGive confidence intervals or at least the test size.
MistakeComparing models with unpaired tests.
InsteadUse paired bootstrap or McNemar on the same examples.
MistakeTreating confidence scores as probabilities without checking.
InsteadMeasure calibration and recalibrate on validation data.
MistakeTesting only on in-distribution data.
InsteadStress test with shifts, perturbations and edge cases.
MistakeAnswering every input, however unusual.
InsteadDetect out-of-scope inputs and abstain or defer.
Summary and key terms
- Test scores have uncertainty; report confidence intervals.
- Interval width shrinks with the square root of test size.
- Compare models with paired methods; distinguish significance from importance.
- Calibration makes confidence scores trustworthy; ECE summarizes it.
- Temperature scaling fixes overconfidence without changing rankings.
- Stress tests probe perturbations, shifts, edge cases and behavior.
- Out-of-distribution detection and human evaluation complete a rigorous evaluation.
- Standard error
- Estimated standard deviation of an estimate.
- Confidence interval
- Range likely to contain the true value.
- McNemar's test
- Paired test using disagreements between models.
- Calibration
- Agreement between confidence and observed frequency.
- Reliability diagram
- Plot of observed frequency against confidence.
- ECE
- Expected calibration error.
- Temperature scaling
- Dividing logits by a fitted constant.
- Distribution shift
- Change in data between training and use.
- Abstention
- Declining to predict on uncertain inputs.
- Coverage
- Share of inputs the system answers.
Practice problems
Work each problem on paper first, then reveal the answer to check.
Standard error of 0.80 accuracy on 400 examples?
Show answer
√(0.16/400) = 0.02.
95 % interval for that result?
Show answer
About 0.76 to 0.84.
How much must the test set grow to halve the interval?
Show answer
Four times.
Which examples matter in McNemar's test?
Show answer
Those where the models disagree.
What does a well-calibrated 70 % mean?
Show answer
About 70 % of such cases are positive.
Does temperature scaling change AUC?
Show answer
No; it preserves ranking.
Name three stress tests.
Show answer
Noise, temporal shift, new sources, invariance, out-of-scope inputs.
What is an invariance test?
Show answer
A change that should not alter the output.
What does a coverage–accuracy curve show?
Show answer
Accuracy rising as the system abstains on more uncertain cases.
Why blind human raters?
Show answer
To avoid bias toward a known system.
Lesson quiz · 5 questions
Score 60% or more to complete this lesson.
Create a free account to save your progress, take quizzes and earn a certificate.