
AI-499 · Lesson 11 of 12 · 24 min
Cost, documentation and the technical report
A capstone is judged largely through its documents: the technical report, the repository and its README, the model card and datasheet, and the presentation. Good documentation lets reviewers understand what was built, trust the evaluation, reproduce the results and decide whether the system should be used. It also forces the team to state clearly what it learned. Alongside documentation, a credible project explains what the system would cost to run, because a model that is accurate but unaffordable is not a solution. This lesson covers estimating compute and operating costs, writing the technical report section by section, preparing a reproducible repository, writing for different audiences, and common pitfalls in reporting results.
Estimating operating cost
Every deployed AI system has running costs: compute for inference, storage, data transfer, monitoring, and for LLM-based systems, API charges per token. Estimating cost early prevents unpleasant surprises and informs design choices such as model size, caching and batching. The basic method multiplies the expected volume of requests by the cost per request, then adds fixed costs. For LLM APIs, cost per request depends on input and output tokens at the provider's prices; for self-hosted models, it depends on hardware cost per hour and the number of requests the hardware can serve.
import numpy as np
# Estimating serving cost and checking it against the project budget
requests_per_day = 20000
tokens_in, tokens_out = 1200, 300                 # per request, for an LLM-based feature
price_in, price_out = 3.0, 15.0                   # dollars per million tokens (illustrative)
daily = requests_per_day * (tokens_in * price_in + tokens_out * price_out) / 1e6
print(f"LLM API cost: ${daily:,.2f} per day, ${daily * 30:,.0f} per month")
cache_hit = 0.35                                  # share of requests answered from a cache
print(f"with a {cache_hit:.0%} cache hit rate: ${daily * (1 - cache_hit) * 30:,.0f} per month")
# Self-hosted alternative: one GPU at a fixed hourly price and a measured throughput
gpu_hour, throughput = 2.50, 2500                 # dollars per hour, output tokens per second
gpus = int(np.ceil(requests_per_day * tokens_out / 86400 / throughput * 3))   # 3x headroom for peaks
print(f"self-hosted: {gpus} GPU(s), ${gpus * gpu_hour * 24 * 30:,.0f} per month before engineering time")LLM API cost: $162.00 per day, $4,860 per month with a 35% cache hit rate: $3,159 per month self-hosted: 1 GPU(s), $1,800 per month before engineering time
At 20,000 requests a day with long prompts, the API cost is a few thousand dollars a month, which caching repeated questions reduces substantially. A single self-hosted GPU could serve the same volume more cheaply in hardware terms, but the comparison excludes the engineering time to deploy, scale, secure and maintain a self-hosted model, which for a small organization often exceeds the savings. Cost estimates should state their assumptions, such as prices, volumes and token counts, so that the partner can update them.
Worked problem
Cost per useful outcome
An invoice extraction pipeline costs $0.012 per invoice to run and processes 9,000 invoices a month. Staff previously spent 4 minutes per invoice on data entry at a loaded labor cost of $40 per hour; with the system, they spend 1 minute per invoice checking its output. What is the monthly saving?
Show solution
- System cost: 9,000 × $0.012 = $108 per month.
- Labor before: 9,000 × 4 min = 36,000 min = 600 h × $40 = $24,000.
- Labor after: 9,000 × 1 min = 150 h × $40 = $6,000.
- Net saving: $24,000 − $6,000 − $108 ≈ $17,900 per month, before hosting, maintenance and error costs.
Answer: About $17,900 per month gross; the comparison should also account for the cost of the system's errors that checking misses and for maintenance.
The technical report
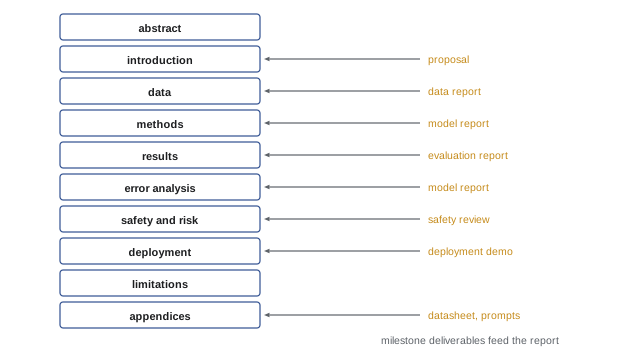
The final technical report is typically 10 to 20 pages plus appendices, organized much like a research paper or an engineering design document:
- Abstract: a paragraph stating the problem, approach, main result with its uncertainty, and key limitation.
- Introduction and problem statement: the need, users, decision and why it matters.
- Related work and baselines: existing solutions, published approaches and the current process.
- Data: sources, permissions, collection, labeling, quality audit, splits and a summary of the datasheet.
- Methods: the system architecture and models, with enough detail to reproduce, and the reasoning behind major choices.
- Experiments and results: baselines, the experiment sequence, ablations, final results with confidence intervals, slice results and robustness tests.
- Error analysis: typical failures with examples and their causes.
- Safety, fairness and risk: summary of the review, mitigations and residual risks, with the model card.
- Deployment: architecture, monitoring, cost and handover status.
- Limitations and future work: what the system cannot do, where it should not be used, and what would come next.
- Contributions: what each team member did.
- References and appendices: citations, additional results, prompts, hyperparameters and the datasheet.
Writing results honestly
The results section is where credibility is won or lost. Report the primary metric for the final model and every baseline on the same test set, with confidence intervals; report means and spreads over seeds where training is stochastic; show slice and robustness results, including the weak ones; state how many configurations were tried and how the final one was chosen, so that readers can judge the risk of overfitting the validation set; and describe any deviations from the plan in the proposal. Avoid language that overclaims, such as "solves", "human-level" or "unbiased", unless the evidence supports it precisely. A clear statement such as "the system extracts all fields correctly on 87 % (95 % CI 84–90 %) of invoices from unseen suppliers, against 71 % for the current templates; accuracy falls to 64 % on scanned documents" tells readers exactly what they need to know.
Figures and tables
Good figures make results easy to grasp. Use tables for precise comparisons across models and metrics, bar or dot plots with error bars for comparisons with uncertainty, line plots for learning curves and drift over time, reliability diagrams for calibration, confusion matrices for classification errors, and example outputs, with failures as well as successes, for qualitative results. Every figure needs a caption that states what it shows and the main takeaway, labeled axes with units, and enough contrast and size to read when printed. Avoid charts that exaggerate differences, such as bar charts with truncated axes.
The repository and README
The code repository is part of the deliverable. A good repository has a clear structure, for example separate directories for source code, configuration, notebooks, tests, scripts and documentation; a README that explains what the project does, how to install dependencies, how to obtain data, how to reproduce the main results with specific commands, how to run the demonstration, and where to find the report and model card; pinned dependencies; scripts or a workflow tool that run the pipeline end to end; tests that pass; and no secrets, personal data or large binary files committed. A license file states how others may use the code, subject to the partner agreement. The fresh-clone reproduction test from Lesson 5 is the final check.
| Item | Purpose |
|---|---|
| README | Overview, setup, reproduction commands, demo instructions |
| requirements file or container | Pinned environment |
| configs/ | Experiment and model configuration |
| src/ | Reusable, tested code |
| scripts/ | Entry points for data processing, training, evaluation |
| tests/ | Unit and integration tests |
| docs/ | Report, model card, datasheet, decision log |
| LICENSE | Terms for reuse of the code |
Writing for different audiences
The same project must be explained to different readers. Technical reviewers want methods, evaluation details and reproducibility. Partner managers want to know what the system does, how well, at what cost, with what risks, and what they need to decide. End users want to know how to use it, when to trust it and how to report problems. A one-page executive summary, a technical report, a model card and a short user guide serve these audiences without forcing any of them to read documents written for others. Plain language, concrete examples and honest statements of limitations help every audience.
Common reporting pitfalls
Reviewers frequently see the same problems in capstone reports: results without baselines or uncertainty; test sets that were used for tuning; vague descriptions of data and preprocessing that prevent reproduction; figures without captions or units; claims of fairness based only on overall metrics; missing discussion of failure cases; contributions that are unclear; and limitations sections that list only generic issues, such as "more data would help", rather than specific findings. Peer review of drafts within the class, using the course rubric, catches many of these before submission.
Writing clearly
Clear technical writing follows a few principles. Put the main point first in each section and paragraph. Use concrete numbers rather than vague words such as "significant" or "much better", and reserve "significant" for statistical significance. Define terms and acronyms on first use. Prefer short sentences and active voice. Keep terminology consistent: if the report calls something a "document", it should not also be a "file" and a "record". Have someone outside the team read the abstract and introduction; if they cannot explain the project afterwards, revise.
Citing sources and tools
The report must credit the work it builds on: datasets, pretrained models, libraries, published methods and any code adapted from others. Use a consistent citation style, include licenses where required, and state clearly which parts were the team's own work. If AI tools were used to help write code or text, follow the program's policy on disclosure, and remember that the team remains responsible for the accuracy of everything submitted.
Documenting decisions
Reviewers often ask why a team made a particular choice: why this model, this split, this threshold, this data source. The decision log kept throughout the project provides the answers, and the report should summarize the most important decisions with their reasons and the alternatives considered. A short table of key decisions, with dates and evidence, shows that the project was run deliberately and makes it easier for others to build on.
Documenting prompts and configurations
For LLM-based systems, the prompts, retrieval settings, model identifiers and versions, temperature and other generation settings are as important as model weights are for trained models. Include them in an appendix or the repository, with the evaluation results for the final configuration, so that others can reproduce the system's behavior and understand how it was tuned.
Accessibility of documents
Reports, slides and demonstrations should be accessible: use sufficient color contrast, avoid relying on color alone to distinguish series in charts, provide alternative text for figures, use real headings in documents, and caption any video. Accessible documents reach every reviewer and partner, and they reflect the same care for users that the system itself should show.
Review before submission
Schedule a full internal review of the report at least a week before the deadline. Each team member reads the whole document, checks that numbers match the latest results, that figures and tables are referenced and captioned, and that claims are supported by evidence. Inconsistent numbers between sections are a common and avoidable problem.
Good documentation is also a gift to the future. Months later, team members, partners or new students may need to understand, rerun or extend the work, and a clear report, repository and decision log make that possible without contacting the original team.
Before submitting, check the report against the course rubric item by item, and make sure that every claim in the abstract and conclusion is supported by a specific result in the body.
Common mistakes
MistakeIgnoring operating cost.
InsteadEstimate cost per request and per outcome with stated assumptions.
MistakeWriting the report in the final week.
InsteadAssemble it from milestone documents throughout the term.
MistakeReporting only the best results.
InsteadInclude baselines, uncertainty, slices and failures.
MistakeA README without reproduction steps.
InsteadGive exact commands to reproduce the main results.
MistakeOne document for every audience.
InsteadProvide a summary, report, model card and user guide.
Summary and key terms
- Estimate operating cost from volume, cost per request and fixed costs.
- Compare costs with the value of outcomes, including error costs.
- The technical report follows a standard structure from abstract to appendices.
- Report results honestly with baselines, intervals, slices and failures.
- Figures need captions, labeled axes and honest scales.
- A reproducible repository has a README, pinned environment, scripts and tests.
- Write separately for technical reviewers, managers and users.
- Operating cost
- Ongoing cost of running a system.
- Cost per request
- Cost of handling one input.
- Caching
- Reusing earlier results for repeated requests.
- Technical report
- Full written account of a project.
- Abstract
- Brief summary of the whole report.
- Confusion matrix
- Table of predicted against actual classes.
- README
- Entry document for a code repository.
- Pinned dependencies
- Exact library versions recorded.
- Executive summary
- Short summary for decision-makers.
- Peer review
- Critique of work by classmates.
Practice problems
Work each problem on paper first, then reveal the answer to check.
Monthly API cost for 10,000 requests a day at $0.004 each?
Show answer
$1,200.
Why include engineering time in self-hosting comparisons?
Show answer
It often exceeds hardware savings.
Name six report sections.
Show answer
Abstract, introduction, data, methods, results, error analysis, safety, deployment, limitations.
What should results always include?
Show answer
Baselines and uncertainty.
Why state how many configurations were tried?
Show answer
So readers can judge validation overfitting.
Name a misleading chart practice.
Show answer
Truncated bar chart axes.
What must a README include?
Show answer
Overview, setup, data access, reproduction commands, demo instructions.
What must never be committed?
Show answer
Secrets, personal data, large binaries.
What document suits partner managers?
Show answer
A one-page executive summary.
What makes a limitations section useful?
Show answer
Specific findings rather than generic statements.
Lesson quiz · 5 questions
Score 60% or more to complete this lesson.
Create a free account to save your progress, take quizzes and earn a certificate.