
AI-460 · Lesson 11 of 12 · 25 min
Documentation, transparency and explainability
Fairness and privacy measurements only help if the people who build, buy, regulate and are affected by AI systems can see them. Transparency has two complementary parts. Documentation records what a data set or model is, how it was made, how it performs and where it should not be used. Explainability helps people understand why a model produced a particular output, so they can trust it appropriately, find errors and contest decisions. This lesson covers datasheets, model cards and system cards, the main explanation techniques, including permutation importance, SHAP, LIME and counterfactual explanations, and the limits of explanation.
Datasheets for data sets
Gebru and colleagues proposed datasheets for data sets, modeled on the datasheets that accompany electronic components. A datasheet answers structured questions in seven sections: motivation (why was the data set created, and by whom), composition (what the instances represent, how many there are, whether any groups are identifiable, whether there is sensitive data), collection process (how data were acquired, by whom, with what consent), preprocessing and labeling (what cleaning was done, who labeled, under what instructions), uses (what it has been and should not be used for), distribution, and maintenance. Writing a datasheet forces creators to confront representation, consent and labeling choices, and gives users the information needed to judge fitness for their purpose. Related formats include data statements for language data and the Data Nutrition Label.
Model cards
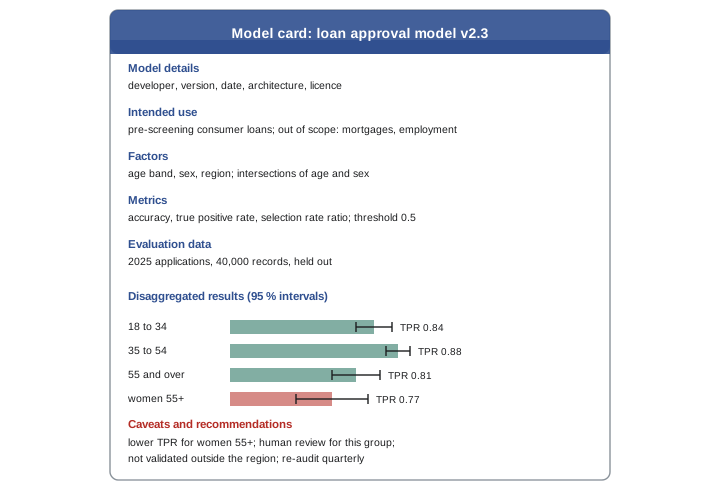
Mitchell and colleagues proposed model cards: short documents accompanying a trained model that report its intended use and performance. A model card typically includes:
- Model details: developer, version, date, architecture and license.
- Intended use: primary uses and users, and out-of-scope uses.
- Factors: groups, instrumentation and environments relevant to performance.
- Metrics: which performance and fairness measures were chosen, and why, with decision thresholds.
- Evaluation data and training data: what was used and why it is representative.
- Quantitative analyses: results disaggregated by factors and intersections, with confidence intervals.
- Ethical considerations, caveats and recommendations: known limitations, risks and mitigations.
Model cards have become standard on model hubs such as Hugging Face, and the developers of large foundation models publish longer system cards describing training data, evaluations for capabilities and risks, red teaming and safeguards. A good model card is specific and honest about limitations; a card listing only headline accuracy is little more than marketing.
Why explanations matter
Explanations serve different audiences. Developers use them to debug models and detect reliance on spurious features, such as a pneumonia classifier that learned to read the hospital's scanner tag rather than the lungs. Domain experts use them to decide whether to trust a prediction. Affected people need them to understand and contest decisions, and laws in several jurisdictions require reasons for adverse decisions in credit and require information about automated decision-making. Regulators and auditors use them to check compliance. Each audience needs a different kind of explanation, so asking "explainable to whom, for what purpose?" comes first.
Interpretable models
The simplest route to explanation is a model that is interpretable by design: linear and logistic regression with few features, shallow decision trees, rule lists, scoring systems with small integer points, and generalized additive models (GAMs) such as explainable boosting machines, which learn a separate shape function for each feature. Cynthia Rudin has argued that for high-stakes decisions on tabular data, interpretable models often match the accuracy of black boxes and should be preferred, because post-hoc explanations of black boxes can be unfaithful. For images, audio and text, deep models usually win, and post-hoc explanations are needed.
Global explanations: permutation importance
Global explanations describe a model's behavior overall. Permutation importance measures how much a performance metric drops when the values of one feature are randomly shuffled across rows, breaking its relationship with the outcome while keeping its distribution. Partial dependence plots and accumulated local effects plots show how predictions change, on average, as one feature varies.
import numpy as np
# Explaining a credit model: permutation importance and a counterfactual explanation
rng = np.random.default_rng(11)
n = 8000
names = ["income_k", "debt_ratio", "late_payments", "years_employed", "postal_area"]
x = np.column_stack([rng.lognormal(4.0, 0.4, n), rng.uniform(0, 0.8, n), rng.poisson(0.8, n),
                     rng.exponential(5, n), rng.integers(0, 10, n)])
logit = 0.04 * x[:, 0] - 5.0 * x[:, 1] - 0.9 * x[:, 2] + 0.08 * x[:, 3] - 0.5
y = rng.random(n) < 1 / (1 + np.exp(-logit))
mu, sd = x.mean(0), x.std(0)
z = np.column_stack([(x - mu) / sd, np.ones(n)])
w = np.zeros(6)
for _ in range(2000):
    p = 1 / (1 + np.exp(-z @ w))
    w -= 0.5 * z.T @ (p - y) / n
def predict(xr):
    zr = np.column_stack([(xr - mu) / sd, np.ones(len(xr))])
    return 1 / (1 + np.exp(-zr @ w))
base = np.mean((predict(x) > 0.5) == y)
print(f"accuracy {base:.3f}; permutation importance (accuracy drop when a feature is shuffled):")
for j, nm in enumerate(names):
    xp = x.copy(); xp[:, j] = rng.permutation(xp[:, j])
    print(f"  {nm:15s} {base - np.mean((predict(xp) > 0.5) == y):.3f}")
# counterfactual: the smallest change to actionable features that flips a rejection
applicant = np.array([[55.0, 0.45, 1, 3.0, 3]])
print(f"applicant approval probability: {predict(applicant)[0]:.2f}")
best = None
for d_debt in np.arange(0, 0.41, 0.05):
    for d_late in (0, 1, 2):
        c = applicant.copy(); c[0, 1] -= d_debt; c[0, 2] -= d_late
        if c[0, 1] >= 0 and c[0, 2] >= 0 and predict(c)[0] > 0.5:
            cost = d_debt / 0.1 + d_late            # treat 0.1 of debt ratio as one unit of effort
            if best is None or cost < best[0]:
                best = (cost, d_debt, d_late, predict(c)[0])
print(f"counterfactual: lower debt ratio by {best[1]:.2f} and reduce late payments by {best[2]} -> probability {best[3]:.2f}")accuracy 0.767; permutation importance (accuracy drop when a feature is shuffled): income_k 0.083 debt_ratio 0.138 late_payments 0.056 years_employed 0.019 postal_area 0.000 applicant approval probability: 0.23 counterfactual: lower debt ratio by 0.10 and reduce late payments by 1 -> probability 0.54
Debt ratio is the most important feature (shuffling it reduces accuracy by 0.138), followed by income and late payments; postal area has no importance, which is what we would hope, since it did not influence the true outcome in this simulation. In a real audit, a non-zero importance for postal area could indicate a proxy for a protected attribute. Permutation importance has caveats: correlated features share importance, so shuffling one may underestimate its role if another carries the same information, and shuffling can create unrealistic combinations of feature values.
Local explanations: SHAP and LIME
Local explanations describe why a model made a particular prediction. LIME (Local Interpretable Model-agnostic Explanations) perturbs the input, observes how predictions change and fits a simple weighted linear model in the neighborhood, whose coefficients serve as the explanation. SHAP (SHapley Additive exPlanations) attributes the prediction to features using Shapley values from cooperative game theory: each feature's contribution is its average marginal effect across all orders in which features could be added. SHAP values sum to the difference between the prediction and the average prediction, a property called local accuracy.
Computing exact Shapley values is exponential in the number of features, so SHAP uses efficient approximations, including exact fast algorithms for tree models. For images and text, saliency methods such as integrated gradients highlight input regions that most influence the output, and for language models, attention patterns and feature attribution are supplemented by mechanistic interpretability research that studies internal circuits.
Counterfactual explanations and recourse
A counterfactual explanation states the smallest change to the input that would have changed the decision: "if your debt ratio were 0.10 lower and you had one fewer late payment, the loan would have been approved." Wachter and colleagues proposed counterfactuals as a way to explain decisions without revealing the model's internals. In the example above, the applicant's approval probability is 0.23; the search finds that reducing the debt ratio by 0.10 and late payments by one lifts it to 0.54. Good counterfactuals change only actionable features (not age or ethnicity), are plausible, and respect causal dependencies. Algorithmic recourse is the broader goal that people have a feasible way to obtain a better outcome, and it is a fairness issue in itself: if recourse is much costlier for one group, the system is unfair even with equal error rates.
Limits and risks of explanations
Explanations can mislead. Post-hoc methods can give different answers for the same prediction, depend on choices such as the background data set, and be unfaithful to what the model actually does. Researchers have shown that models can be manipulated to hide discriminatory behavior from LIME and SHAP. Explanations can also create unwarranted trust, leading users to accept wrong predictions because they look well-explained. And detailed explanations can leak information about training data or help people game the model. Good practice evaluates explanation faithfulness, presents explanations with uncertainty, tailors them to the audience and tests whether they actually help users make better decisions.
In the United States, the Equal Credit Opportunity Act and Regulation B require creditors to give specific principal reasons for adverse actions, and the Consumer Financial Protection Bureau has stated that this applies even when complex algorithms are used; the Fair Credit Reporting Act adds notice requirements when credit reports are used.
Worked problem
Explaining a single prediction with additive attributions
A model's average predicted approval probability is 0.55. For one applicant it predicts 0.30, with SHAP values: debt ratio −0.18, late payments −0.10, income +0.05, years employed −0.02. Check the attributions and write a plain explanation.
Show solution
- Sum of SHAP values: −0.18 − 0.10 + 0.05 − 0.02 = −0.25.
- Average plus sum: 0.55 − 0.25 = 0.30, matching the prediction (local accuracy).
- Largest negative factors: debt ratio, then late payments.
- Plain explanation: "Your application scored lower mainly because of your debt relative to income and two recent late payments; your income helped."
- Add a counterfactual where possible: the change in debt ratio that would lead to approval.
Answer: The attributions sum correctly; debt ratio and late payments are the principal reasons.
Explanations for affected people
Explanations given to the people affected by a decision need different qualities from those used by developers. They should be specific to the person, written in plain language, focused on the most important factors, and paired with information about how to contest the decision or improve the outcome. Notices that list generic factors, such as "credit history, income and other information", do not meet this standard. User studies show that people find counterfactual explanations easier to act on than lists of feature weights, but that explanations can also reduce scrutiny when they sound authoritative. Testing explanations with representative users, and checking that they lead to better understanding and appropriate reliance rather than blanket trust, is part of responsible deployment.
Documentation as a living record
Documentation is only useful if it stays current. Model cards should be versioned with the model, updated whenever the model is retrained, its training data change, or monitoring reveals new limitations, and linked to the evaluation code that produced their numbers so results can be reproduced. Generating parts of the card automatically from the evaluation pipeline, such as disaggregated metric tables, keeps the figures in step with the model, while the narrative sections on intended use and limitations still require human judgment and review by someone outside the development team.
Common mistakes
MistakePublishing a model card with only overall accuracy.
InsteadReport disaggregated results, intended use and limitations.
MistakeUsing a black box when an interpretable model performs as well.
InsteadPrefer interpretable models for high-stakes tabular decisions.
MistakeTreating SHAP or LIME output as ground truth.
InsteadCheck faithfulness and stability.
MistakeOffering counterfactuals that change immutable features.
InsteadRestrict to actionable, plausible changes.
MistakeGiving one explanation for all audiences.
InsteadTailor explanations to developers, experts and affected people.
Summary and key terms
- Datasheets document data set motivation, composition, collection and uses.
- Model cards report intended use and disaggregated performance.
- Explanations serve developers, experts, affected people and regulators differently.
- Interpretable models are often competitive on tabular data.
- Permutation importance measures global feature reliance.
- SHAP and LIME give local attributions; SHAP values sum to the prediction difference.
- Counterfactuals support recourse but must use actionable changes.
- Datasheet
- Structured documentation of a data set.
- Model card
- Documentation of a model's use and performance.
- System card
- Documentation of a deployed system's evaluations and safeguards.
- Interpretable model
- A model understandable by design.
- Permutation importance
- Metric drop when a feature is shuffled.
- LIME
- Local surrogate linear explanations.
- SHAP
- Shapley value feature attributions.
- Local accuracy
- Attributions summing to the prediction difference.
- Counterfactual explanation
- Smallest change that flips a decision.
- Algorithmic recourse
- A feasible path to a better outcome.
Practice problems
Work each problem on paper first, then reveal the answer to check.
Name four datasheet sections.
Show answer
Motivation, composition, collection, preprocessing, uses, distribution, maintenance.
What should a model card's quantitative analysis include?
Show answer
Disaggregated results with confidence intervals.
What did the pneumonia classifier example show?
Show answer
Models can rely on spurious features like scanner tags.
How is permutation importance computed?
Show answer
Shuffle a feature and measure the metric drop.
In C11, which feature was most important?
Show answer
Debt ratio, 0.138.
What would non-zero importance for postal area suggest?
Show answer
A possible proxy for a protected attribute.
What property makes SHAP values sum to the prediction difference?
Show answer
Local accuracy.
In C11, what counterfactual was found?
Show answer
Debt ratio down 0.10 and one fewer late payment.
Why is recourse a fairness issue?
Show answer
Unequal recourse costs disadvantage groups.
Name a risk of explanations.
Show answer
Unfaithfulness, manipulation, overtrust, leakage, gaming.
Lesson quiz · 5 questions
Score 60% or more to complete this lesson.
Create a free account to save your progress, take quizzes and earn a certificate.