
AERO-220 · Lesson 2 of 12 · 24 min
The drag polar
Every performance number Arjun will promise the airline depends on drag. Range, climb, maximum speed and endurance all come down to how much force it takes to push the Tern through the air at a given speed and weight. Engineers summarize that information in a single relation between the drag coefficient and the lift coefficient: the drag polar. This lesson explains where each part of the polar comes from, how engineers estimate it before an aircraft flies and measure it afterwards, and why a few thousandths of a drag coefficient matter so much commercially.
Drag coefficient and the two families of drag
Drag, like lift, is written in terms of dynamic pressure, wing reference area and a coefficient: \(D = \tfrac{1}{2}\rho V^2 S C_D\). The drag coefficient is not a constant. It changes with the lift coefficient, the configuration (flaps, landing gear), the Mach number and, more weakly, the Reynolds number. For performance work, the drag is split into two broad families that behave differently with speed.
Parasite drag is the drag the aircraft would have even if it produced no lift. It includes skin friction, the viscous shear of air along every wetted surface; form or pressure drag, caused by the flow separating behind bluff shapes; interference drag, from the way flows around different parts meet at junctions such as the wing root; and miscellaneous contributions from antennas, gaps, leakage, cooling flows and excrescences such as rivet heads. Together these make up the zero-lift drag coefficient \(C_{D0}\), which stays roughly constant over the normal speed range.
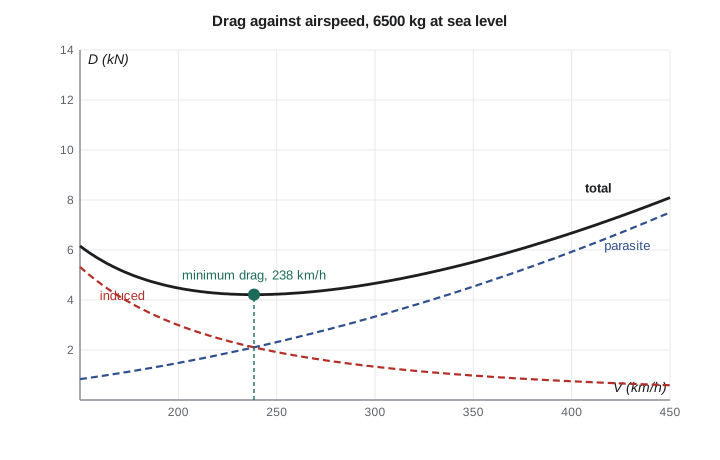
Induced drag is the price of making lift with a wing of finite span. The wing pushes air downward to create lift, and the pressure difference between the lower and upper surfaces drives air around the wingtips, creating trailing vortices. The downwash these vortices produce tilts the local lift vector backward, and the backward component is induced drag. Induced drag grows with the square of the lift coefficient and falls with aspect ratio, which is why gliders and long-range aircraft have long, slender wings.
The Oswald efficiency factor \(e\) accounts for the fact that real wings do not have the ideal elliptical lift distribution and that the fuselage, nacelles and the viscous drag of the wing all vary with lift. Typical values run from about 0.7 for older or less refined designs to 0.85 or more for clean modern wings with well-designed tips. The Tern, with an aspect ratio of 10.3 and \(e = 0.80\), has \(k = 1/(\pi \times 10.3 \times 0.80) = 0.0386\).
The parabolic drag polar
Adding the two families gives the parabolic drag polar, the workhorse of preliminary performance analysis. It says the drag coefficient is a constant plus a term proportional to the square of the lift coefficient. Plotted with \(C_D\) on the horizontal axis and \(C_L\) on the vertical axis, it is a parabola lying on its side.
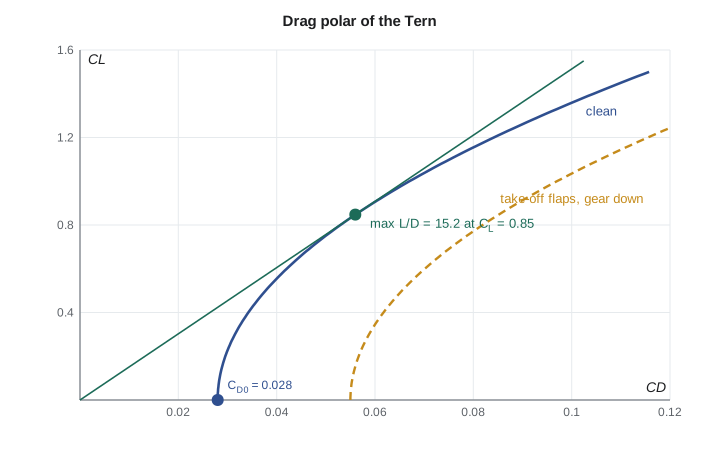
A straight line from the origin to any point on the polar has a slope equal to \(C_L/C_D\), the lift-to-drag ratio at that point. The steepest such line just touches the polar, and its point of contact gives the maximum lift-to-drag ratio. Setting the derivative of \(C_L/C_D\) to zero shows that this happens where induced drag equals parasite drag. The Tern's maximum L/D is 15.2, at a lift coefficient of 0.85.
These two results are worth memorizing, because so much follows from them. Maximum L/D depends only on the product \(k\,C_{D0}\), so halving the zero-lift drag and doubling the aspect ratio improve it by the same factor. The lift coefficient for maximum L/D does not depend on weight or altitude, so an aircraft always reaches its best L/D at the same angle of attack. The speed at which that happens, however, does depend on weight and density, as Lesson 3 shows.
Estimating the zero-lift drag before first flight
Before an aircraft flies, engineers estimate \(C_{D0}\) by adding up the parasite drag of each component, a method called the component build-up. Each part's contribution is its skin friction coefficient \(C_f\), which depends on Reynolds number and how much of the surface keeps a smooth laminar boundary layer, times a form factor FF that accounts for thickness and pressure drag, times an interference factor Q, times its wetted area, divided by the wing reference area. A percentage is added for leakage, protuberances and other miscellaneous items.
Wetted area matters more than many students expect. The Tern's total wetted area is about 145 m², roughly 1560 ft², more than five times its wing area. A cleaner fuselage shape, smaller nacelles and well-faired junctions can reduce \(C_{D0}\) by several percent, worth the same as a large improvement in engine efficiency. Laminar-flow wing sections can cut skin friction substantially over part of the wing, but only if the surface stays very smooth and free of insects, ice and rivet steps.
# Building the Tern's drag polar from components, then fitting it to flight-test points
import math
S = 28.0                                     # wing reference area, m2
# Component build-up: C_D0 = sum(Cf * FF * Q * S_wet) / S_ref
parts = {   #  name: (S_wet m2, skin friction Cf, form factor FF, interference Q)
    'wing':        (49.0, 0.0034, 1.35, 1.00),
    'fuselage':    (62.0, 0.0029, 1.20, 1.00),
    'tail':        (22.0, 0.0036, 1.30, 1.05),
    'nacelles':    (12.0, 0.0038, 1.40, 1.30),
}
total = 0.0
for name, (swet, cf, ff, qi) in parts.items():
    cd = cf * ff * qi * swet / S
    total += cd
    print(f"{name:10s} C_D0 contribution {cd:.4f}")
misc = 0.10 * total                          # gaps, antennas, leakage, landing gear fairings
print(f"Sum {total:.4f}, plus 10% miscellaneous = {total + misc:.4f}")
# Induced drag factor from aspect ratio and Oswald efficiency
AR, e = 10.3, 0.80
k = 1 / (math.pi * AR * e)
print(f"k = 1/(pi*AR*e) = {k:.4f}")
# Least-squares fit of C_D = C_D0 + k*C_L^2 to flight-test points (x = C_L^2, y = C_D)
tests = [(0.30, 0.0316), (0.45, 0.0358), (0.60, 0.0420), (0.75, 0.0496), (0.90, 0.0592), (1.05, 0.0712)]
xs = [cl**2 for cl, cd in tests]; ys = [cd for cl, cd in tests]
n = len(xs); xm = sum(xs) / n; ym = sum(ys) / n
k_fit = sum((x - xm) * (y - ym) for x, y in zip(xs, ys)) / sum((x - xm)**2 for x in xs)
cd0_fit = ym - k_fit * xm
e_fit = 1 / (math.pi * AR * k_fit)
print(f"Fitted polar: C_D = {cd0_fit:.4f} + {k_fit:.4f} C_L^2  (Oswald e = {e_fit:.2f})")
LDmax = 1 / (2 * math.sqrt(cd0_fit * k_fit))
CL_md = math.sqrt(cd0_fit / k_fit)
print(f"Max L/D = {LDmax:.1f} at C_L = {CL_md:.2f}")wing C_D0 contribution 0.0080 fuselage C_D0 contribution 0.0077 tail C_D0 contribution 0.0039 nacelles C_D0 contribution 0.0030 Sum 0.0226, plus 10% miscellaneous = 0.0248 k = 1/(pi*AR*e) = 0.0386 Fitted polar: C_D = 0.0279 + 0.0390 C_L^2 (Oswald e = 0.79) Max L/D = 15.2 at C_L = 0.85
The build-up gives a zero-lift drag coefficient of 0.0248, but the fitted flight-test value is 0.0279. That gap is typical and instructive. Early estimates tend to miss items that seem small, such as the air flowing through the cooling ducts for the electric motors, inverters and battery pack, the flap-track fairings, the gaps around control surfaces and the drag of the antennas a commuter aircraft needs. In the Tern's case the thermal management system turned out to be the largest surprise: the battery and power electronics reject a lot of heat during take-off and climb, and the cooling air inlets and outlets add about 0.002 to \(C_{D0}\). Arjun uses the measured value, 0.028, for every number in the bid.
Measuring the polar in flight
Flight testing measures the polar directly. In a series of stabilized points at different speeds, a test aircraft is flown level or in a steady climb or glide while instruments record airspeed, altitude, outside air temperature, weight, engine or motor power and propeller data. From these, engineers compute the lift coefficient from the weight, and the drag coefficient from the thrust or power, corrected for climb rate and acceleration. Plotting \(C_D\) against \(C_L^2\) should give a nearly straight line whose intercept is \(C_{D0}\) and whose slope is \(k\). A least-squares fit, as in the program, finds the best line through the scatter of real data.
Two simpler techniques are popular for light aircraft and drones. In a glide test, the engine is idle or the propeller stopped and feathered, so the drag equals the weight times the sine of the glide angle, measured from the sink rate and speed. In a deceleration test, the aircraft slows in level flight with known thrust, and the deceleration gives the excess drag. Both avoid the uncertainty of estimating propeller thrust, which is the largest source of error in powered drag measurements.
Worked problem
Reading drag numbers from the polar
Using the fitted polar \(C_D = 0.028 + 0.039\,C_L^2\), find the Tern's drag at 6500 kg and 380 km/h at 3000 m, where \(\rho = 0.909\ \text{kg/m}^3\). Then find the lift-to-drag ratio.
Show solution
- Dynamic pressure: \(q = \tfrac{1}{2} \times 0.909 \times 105.6^2 = 5068\ \text{Pa}\).
- Lift coefficient: \(C_L = 63\,765/(5068 \times 28) = 0.449\).
- Drag coefficient: \(C_D = 0.028 + 0.039 \times 0.449^2 = 0.028 + 0.0079 = 0.0359\).
- Drag: \(D = 5068 \times 28 \times 0.0359 = 5094\ \text{N}\), and \(L/D = 0.449/0.0359 = 12.5\).
Answer: In fast cruise, parasite drag is about 78 percent of the total. The Tern cruises at a lift-to-drag ratio of 12.5, well below its maximum of 15.2, because the airline values speed. Flying slower would save energy per kilometer but add minutes to every trip, and Lesson 7 shows how to balance the two.
Configuration changes: flaps, gear and propellers
Each configuration has its own polar. Extending flaps raises \(C_{D0}\) considerably and changes \(k\), because the lift is concentrated nearer the fuselage. Lowering the landing gear adds a large parasite increment. For the Tern, take-off flaps add about 0.012 to \(C_{D0}\), full landing flaps about 0.040, and the extended landing gear about 0.015. These increments are why aircraft clean up promptly after take-off and why the climb requirements in certification rules specify the configuration in which they must be met.
Propellers complicate drag in a way that pure jets do not. The slipstream behind a propeller flows faster over the parts of the wing and fuselage it washes, increasing their skin friction, but it also increases the lift on those parts. A windmilling propeller, one that is turning in the airflow without power after an engine or motor failure, produces a large drag, often more than the rest of the aircraft's parasite drag on that side. Feathering the propeller, turning its blades edge-on to the flow, cuts that drag dramatically. The Tern's electric motors can stop and feather the propeller automatically within two seconds of a failure, a feature that Lesson 5 shows is essential for climb after a motor failure.
When the parabola is not enough
The parabolic polar is an approximation, and it fails in three places. At high lift coefficients, approaching the stall, flow separation makes the drag rise faster than the parabola predicts. At very low lift coefficients, some wings have their minimum drag at a small positive lift coefficient, not at zero, because of camber; a modified polar \(C_D = C_{D,min} + k(C_L - C_{L,mindrag})^2\) captures this. And at high Mach numbers, shock waves add wave drag that rises steeply above the drag-divergence Mach number, typically around Mach 0.7 to 0.8 for transport wings. The Tern cruises near Mach 0.32, far from that region, but the regional jet Arjun uses for comparison in Lesson 4 flies near Mach 0.78 and is designed around it.
| Effect | Where it matters | How engineers handle it |
|---|---|---|
| Separation near stall | Take-off, landing, low-speed maneuvering | Use measured polar data near C_L,max |
| Cambered-wing minimum drag offset | Gliders, laminar-flow wings | Modified polar with C_L at minimum drag |
| Wave drag above drag divergence | Jet cruise near Mach 0.75 to 0.85 | Mach-dependent polars from wind tunnel data |
| Reynolds number | Small drones, scale models | Correct skin friction for the real Reynolds number |
| Propeller slipstream | Powered propeller aircraft at low speed | Power-on polars from flight test |
Drones such as the Skiff-W operate at Reynolds numbers ten to fifty times lower than full-size aircraft, because they are small and slow. Skin friction coefficients are higher and laminar separation bubbles can form on the wing, so their polars are less favorable than geometry alone suggests. Sam Littlechild, who leads the Skiff program, measured the Skiff-W's polar with a mix of wind tunnel runs and glide tests, finding \(C_{D0} = 0.030\) and \(e = 0.85\) on its aspect-ratio-12 wing, for a maximum L/D of about 16.3.
Why a drag count matters
Engineers often speak of drag counts, where one count is a drag coefficient of 0.0001. The Tern's zero-lift drag is 280 counts. Reducing it by 10 counts, about 3.6 percent of \(C_{D0}\), would reduce cruise drag by about 2.8 percent at the airline's cruise speed and extend range or cut energy use in proportion. Over an aircraft's service life of perhaps 50,000 flights, a few counts translate into large amounts of fuel and emissions, which is why manufacturers spend heavily on fairings, sealing and surface finish, and why airlines care about keeping aircraft clean and well maintained in service.
Common mistakes
MistakeUsing the reference area as the area that creates skin friction.
InsteadSkin friction acts on the wetted area, which is several times the wing reference area.
MistakeAssuming maximum L/D occurs at a fixed speed.
InsteadMaximum L/D occurs at a fixed lift coefficient; the matching speed changes with weight and density.
MistakeApplying the clean polar to take-off and landing.
InsteadFlaps and landing gear change both C_D0 and k; each configuration has its own polar.
MistakeIgnoring a windmilling propeller's drag after a failure.
InsteadA windmilling propeller can add more drag than the rest of the aircraft on that side; feathering it is essential.
MistakeTrusting an early component build-up without margin.
InsteadBuild-ups usually underestimate C_D0; add margin until wind tunnel or flight data arrive.
Summary and key terms
- Drag splits into parasite drag, roughly constant as a coefficient, and induced drag, proportional to C_L².
- The parabolic polar is C_D = C_D0 + kC_L², with k = 1/(πAR e).
- Maximum L/D = 1/(2√(kC_D0)) occurs where induced drag equals parasite drag, at C_L = √(C_D0/k).
- C_D0 can be estimated by a component build-up using skin friction, form factors, interference factors and wetted area.
- Flight tests measure the polar by plotting C_D against C_L² and fitting a straight line.
- Flaps, gear, windmilling propellers, separation and compressibility all change or limit the polar.
- Drag polar
- The relation between drag coefficient and lift coefficient for an aircraft in a given configuration.
- Parasite drag
- Drag that does not depend on lift: skin friction, form, interference and miscellaneous drag.
- Induced drag
- Drag caused by the trailing vortices and downwash of a lifting wing of finite span.
- Oswald efficiency factor
- A factor less than 1 that corrects induced drag for a non-ideal lift distribution and other lift-dependent drag.
- Wetted area
- The total external surface area exposed to the airflow.
- Component build-up
- A method of estimating zero-lift drag by summing the drag of each component.
- Drag count
- A drag coefficient of 0.0001.
- Feathering
- Turning propeller blades edge-on to the airflow to minimize drag when the propeller is not powered.
Practice problems
Work each problem on paper first, then reveal the answer to check.
An aircraft has AR = 8 and e = 0.78. Find k.
Show answer
k = 1/(π × 8 × 0.78) = 0.0510.
For C_D0 = 0.022 and k = 0.045, find maximum L/D and the C_L at which it occurs.
Show answer
(L/D)max = 1/(2√(0.045 × 0.022)) = 15.9 at C_L = √(0.022/0.045) = 0.70.
If the Tern's C_D0 rose from 0.028 to 0.031, by what percentage would maximum L/D fall?
Show answer
L/D ∝ 1/√C_D0: √(0.028/0.031) = 0.950, a fall of about 5 percent.
Flight-test points give C_D = 0.040 at C_L² = 0.20 and C_D = 0.056 at C_L² = 0.60. Find C_D0 and k.
Show answer
k = 0.016/0.40 = 0.040; C_D0 = 0.040 − 0.040 × 0.20 = 0.032.
Why do gliders have very high aspect ratios?
Show answer
Induced drag falls with aspect ratio, so long slender wings give the low k needed for high L/D at low speed.
In the program, raise the Oswald factor of the fitted polar check value from 0.80 to 0.85 in the k calculation. What does k become?
Show answer
k = 1/(π × 10.3 × 0.85) = 0.0364.
Lesson quiz · 5 questions
Score 60% or more to complete this lesson.
Create a free account to save your progress, take quizzes and earn a certificate.