
STAT-235 · Lesson 8 of 12 · 29 min
More inference: variances, proportions, counts and resampling
Lesson 7 built confidence intervals and hypothesis tests for means and for a single proportion. Engineering questions often concern other quantities. Is a filling machine consistent enough, regardless of its average? Is one supplier's defect rate really higher than another's? Are defects spread evenly across shifts, or do they cluster? Does the failure mode depend on the supplier? What if the data are skewed, ranked or too few for normal-theory methods? This lesson extends inference to variances (with the chi-square and F distributions of Lesson 6), to comparisons of two proportions, to counts in categories (chi-square goodness-of-fit and contingency tests), to methods that do not assume normality (nonparametric tests and the bootstrap), and to the pitfalls of running many tests at once. Throughout, the logic is the same as in Lesson 7: a test statistic, its distribution if the null hypothesis is true, and a p-value or interval interpreted in engineering terms.
Inference about a variance
Uniformity is often as important as the average: the fill weight of packages, the thickness of a coating, the diameter of a shaft, the strength of a batch of concrete. For a sample of size n from a normal population, \((n - 1)S^2/\sigma^2\) has a chi-square distribution with n − 1 degrees of freedom (Lesson 6), which gives a confidence interval for σ²:
where \(\chi^2_{\alpha/2}\) is the upper critical value (the larger one). Because the chi-square distribution is skewed, the interval is not symmetric about \(s^2\). Taking square roots gives an interval for σ.
Worked problem
Consistency of a filling machine
Fifteen packages from a filling line have a standard deviation of 2.4 g. Find a 95% confidence interval for the process standard deviation, and decide whether the specification σ ≤ 2.0 g is met.
Show solution
- With 14 degrees of freedom, \(\chi^2_{0.025} = 26.12\) and \(\chi^2_{0.975} = 5.63\).
- \(\sigma^2\): from \(14 \times 5.76/26.12 = 3.09\) to \(14 \times 5.76/5.63 = 14.3\) g².
- \(\sigma\): from 1.76 to 3.79 g.
Answer: The interval 1.76 to 3.79 g includes values well above 2.0 g, so the data do not show that the specification is met; with only 15 packages, σ is poorly determined. Variance estimates need much larger samples than mean estimates for the same relative precision. One caution: these intervals rely heavily on normality, much more than intervals for the mean do, so check the data with a normal probability plot first.
Comparing two variances
To compare the variability of two independent normal populations, use the ratio \(F = s_1^2/s_2^2\), which follows an F distribution with \(n_1 - 1\) and \(n_2 - 1\) degrees of freedom when \(\sigma_1 = \sigma_2\). By convention the larger variance goes on top, and the test is two-sided unless there is a prior reason to expect one process to be more variable.
Comparing two proportions
To compare the proportions of items with some property in two populations, such as defective parts from two suppliers or failures under two designs, use the difference of sample proportions \(\hat{p}_1 - \hat{p}_2\). Under the null hypothesis \(p_1 = p_2\), the pooled proportion \(\hat{p} = (x_1 + x_2)/(n_1 + n_2)\) estimates the common value, and
is approximately standard normal when each sample contains at least about 10 items with and 10 without the property.
Worked problem
Two suppliers
Supplier A delivered 400 parts with 18 defective; supplier B delivered 350 with 7 defective. Is A's defect rate significantly higher?
Show solution
- \(\hat{p}_A = 0.045\), \(\hat{p}_B = 0.020\), pooled \(\hat{p} = 25/750 = 0.0333\).
- Standard error: \(\sqrt{0.0333 \times 0.9667 \times (1/400 + 1/350)} = 0.0131\).
- \(z = 0.025/0.0131 = 1.90\), two-sided p = 0.057.
Answer: Not quite significant at the 5% level (p ≈ 0.06), though A's rate is more than twice B's. The honest conclusion is that the evidence is suggestive but not conclusive; collecting more data, or a one-sided test decided in advance if A was already suspected, would settle it. Note that B has only 7 defectives, near the edge of the approximation; an exact test (Fisher's) gives a similar answer here.
Counts in categories: chi-square tests
Goodness of fit
When observations fall into k categories, the chi-square goodness-of-fit test checks whether the observed counts \(O_i\) are consistent with expected counts \(E_i\) from a hypothesized model:
Large values mean poor agreement. If the model is correct, the statistic has approximately a chi-square distribution with k − 1 degrees of freedom, minus one more for each parameter estimated from the data. The approximation needs expected counts of at least about 5 in each category; combine sparse categories if necessary. The test can check whether defects are spread evenly over shifts, machines or days, or whether failure counts follow a Poisson distribution (Lesson 4).
Worked problem
Defects by shift
Three shifts produce equal quantities. In a month, inspectors find 45, 38 and 67 defective parts. Are defects equally likely on all shifts?
Show solution
- Total 150, so each expected count is 50.
- \(\chi^2 = \dfrac{25}{50} + \dfrac{144}{50} + \dfrac{289}{50} = 9.16\) with 2 degrees of freedom.
- The 5% critical value is 5.99; p = 0.010.
Answer: Defects are not evenly spread (p ≈ 0.01); the third shift contributes most of the chi-square statistic. The test does not say why: it points the investigation toward that shift's staffing, training, lighting or machine set-up.
Contingency tables
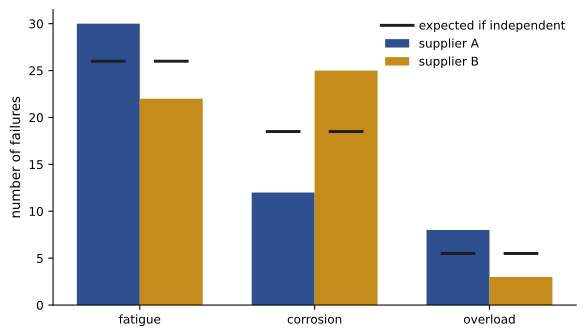
When each item is classified by two categorical variables, such as failure mode and supplier, or defect type and production line, the counts form a contingency table. The chi-square test of independence asks whether the two classifications are related. The expected count for each cell, if they are independent, is (row total × column total)/grand total, and the statistic has (rows − 1) × (columns − 1) degrees of freedom. The code below runs the tests of this lesson.
import numpy as np
from scipy import stats

# F test: are two filling machines equally consistent?
s1, n1, s2, n2 = 3.1, 10, 1.9, 12
F = s1**2 / s2**2
p = 2 * min(stats.f.sf(F, n1 - 1, n2 - 1), stats.f.cdf(F, n1 - 1, n2 - 1))
print(f"F = {F:.2f} with ({n1 - 1}, {n2 - 1}) df, two-sided p = {p:.3f}")

# Two proportions: defect rates from two suppliers
x = np.array([18, 7]); n = np.array([400, 350])
pool = x.sum() / n.sum()
z = (x[0] / n[0] - x[1] / n[1]) / np.sqrt(pool * (1 - pool) * (1 / n[0] + 1 / n[1]))
print(f"Defect rates {x[0] / n[0]:.3f} vs {x[1] / n[1]:.3f}: z = {z:.2f}, two-sided p = {2 * stats.norm.sf(abs(z)):.3f}")

# Chi-square goodness of fit: defects by shift, equal production on each shift
obs = [45, 38, 67]
chi2, p = stats.chisquare(obs)
print(f"Defects by shift {obs}: chi-square = {chi2:.2f}, p = {p:.4f}")

# Contingency table: failure mode by supplier
table = np.array([[30, 12, 8],      # supplier A: fatigue, corrosion, overload
                  [22, 25, 3]])     # supplier B
chi2, p, dof, expected = stats.chi2_contingency(table)
print(f"Failure mode vs supplier: chi-square = {chi2:.2f}, {dof} df, p = {p:.4f}")F = 2.66 with (9, 11) df, two-sided p = 0.129 Defect rates 0.045 vs 0.020: z = 1.90, two-sided p = 0.057 Defects by shift [45, 38, 67]: chi-square = 9.16, p = 0.0103 Failure mode vs supplier: chi-square = 8.07, 2 df, p = 0.0177
The two filling machines do not differ significantly in variability with these sample sizes (p = 0.13). The failure-mode table shows a significant association (p ≈ 0.02): supplier B's parts fail by corrosion far more often, a pointer to coating or material differences that a single overall failure rate would hide.
Nonparametric methods
The t tests of Lesson 7 assume roughly normal data, an assumption that matters most for small samples. When data are strongly skewed, contain outliers, or are only ranks (such as condition ratings from 1 to 5), nonparametric (distribution-free) methods are safer. They work with signs or ranks rather than the values themselves:
- The sign test checks whether the median equals a hypothesized value by counting observations above and below it; under the null hypothesis the count is binomial with p = 0.5 (Lesson 4).
- The Wilcoxon signed-rank test, for paired data or a single median, uses the ranks of the absolute differences and is more powerful than the sign test.
- The Mann-Whitney (Wilcoxon rank-sum) test compares two independent samples by ranking all observations together, the nonparametric counterpart of the two-sample t test.
These tests lose a little power when the data really are normal, typically requiring about 5% more observations, but they can be far more reliable when they are not.
The bootstrap
For many statistics, such as a median, a percentile, a ratio or a correlation, there is no convenient formula for the standard error. The bootstrap estimates it by resampling: treat the sample as a stand-in for the population, draw many new samples of the same size from it with replacement, compute the statistic for each, and use the spread of these bootstrap values as a measure of uncertainty. The 2.5th and 97.5th percentiles of the bootstrap values give a simple 95% interval (the percentile method). The method needs no distributional assumptions, only that the sample is representative and the observations independent, and it is easy to apply to any statistic a computer can calculate.
import numpy as np

rng = np.random.default_rng(11)
# Repair times (hours) for 15 breakdowns: skewed, with one long job
times = np.array([0.8, 1.1, 1.3, 1.5, 1.6, 1.9, 2.0, 2.2, 2.4, 2.9, 3.3, 3.8, 4.6, 6.1, 14.5])
print(f"Sample median {np.median(times):.2f} h, sample mean {times.mean():.2f} h")

boot = [np.median(rng.choice(times, times.size, replace=True)) for _ in range(20000)]
lo, hi = np.percentile(boot, [2.5, 97.5])
print(f"Bootstrap 95% interval for the median: {lo:.2f} to {hi:.2f} h")

boot_mean = [rng.choice(times, times.size, replace=True).mean() for _ in range(20000)]
lo, hi = np.percentile(boot_mean, [2.5, 97.5])
print(f"Bootstrap 95% interval for the mean: {lo:.2f} to {hi:.2f} h")Sample median 2.20 h, sample mean 3.33 h Bootstrap 95% interval for the median: 1.60 to 3.80 h Bootstrap 95% interval for the mean: 2.01 to 5.26 h
The one 14.5-hour job pulls the mean up to 3.3 h and makes its interval wide and lopsided, while the median of 2.2 h is more stable. For planning typical repairs the median is the better summary; for total downtime cost the mean is what matters, and the bootstrap shows how uncertain it is.
Many tests, and what significance means
Each test at the 5% level has a 5% chance of a false alarm when there is no real effect. Run 20 independent tests and the chance of at least one false alarm is \(1 - 0.95^{20} = 0.64\). Searching through many variables, subgroups or outcomes for something significant, and reporting only what turns up, is called data dredging or p-hacking, and it produces findings that fail to replicate. Remedies include deciding the hypotheses before collecting data, adjusting the significance level (the Bonferroni correction tests each of m hypotheses at α/m), and confirming surprising results with new data.
Finally, statistical significance is not engineering significance. With enough data, a difference too small to matter becomes significant; with too little, an important difference may not. Always report the estimated size of the effect with a confidence interval, and judge it against what matters in practice: a tolerance, a cost, a safety margin.
Common mistakes
MistakeUsing a symmetric interval s² ± something for a variance.
InsteadUse the chi-square interval, which is asymmetric.
MistakeApplying variance tests to clearly non-normal data.
InsteadVariance methods are sensitive to non-normality; check first or use the bootstrap.
MistakeRunning a chi-square test with expected counts below about 5.
InsteadCombine categories or use an exact test.
MistakeRunning many tests and reporting only the significant ones.
InsteadPlan hypotheses in advance and adjust for multiple comparisons.
MistakeEquating a significant result with an important one.
InsteadReport the effect size with a confidence interval and judge its practical importance.
Summary and key terms
- A confidence interval for σ² uses the chi-square distribution and is asymmetric; it relies strongly on normality.
- Two variances are compared with F = s₁²/s₂².
- Two proportions are compared with a pooled-standard-error z test.
- Chi-square goodness-of-fit tests compare observed and expected counts with k − 1 (minus estimated parameters) degrees of freedom.
- Contingency-table tests check independence of two classifications with (r − 1)(c − 1) degrees of freedom.
- Sign, Wilcoxon and Mann-Whitney tests avoid normality assumptions; the bootstrap estimates uncertainty for any statistic.
- Multiple testing inflates false alarms; statistical and practical significance differ.
- Chi-square interval for variance
- A confidence interval for σ² based on (n − 1)S²/σ².
- F test
- A test comparing two variances by their ratio.
- Pooled proportion
- The combined proportion of successes used under the null hypothesis of equal proportions.
- Goodness-of-fit test
- A test of whether observed counts match a hypothesized model.
- Contingency table
- A table of counts classified by two categorical variables.
- Test of independence
- A chi-square test of whether two classifications are related.
- Nonparametric test
- A test that does not assume a particular distribution, often based on ranks.
- Mann-Whitney test
- A rank-based comparison of two independent samples.
- Bootstrap
- Estimating uncertainty by resampling the data with replacement.
- Bonferroni correction
- Testing each of m hypotheses at level α/m to control false alarms.
Practice problems
Work each problem on paper first, then reveal the answer to check.
A sample of 21 has s = 0.8 mm. Find a 95% interval for σ (χ²₀.₀₂₅,₂₀ = 34.17, χ²₀.₉₇₅,₂₀ = 9.59).
Show answer
σ² from 0.375 to 1.335; σ from 0.61 to 1.16 mm.
Samples of 16 and 11 have s = 5 and 3. Find F and its degrees of freedom.
Show answer
F = 25/9 = 2.78 with 15 and 10 df.
Line 1: 12 defects in 300; line 2: 30 in 400. Find the pooled proportion.
Show answer
42/700 = 0.06.
Find z for that comparison.
Show answer
p̂ = 0.04 vs 0.075; SE = √(0.06 × 0.94 × (1/300 + 1/400)) = 0.0181; z = −1.93.
A die is rolled 60 times with counts 8, 12, 9, 11, 6, 14. Find χ².
Show answer
E = 10: (4 + 4 + 1 + 1 + 16 + 16)/10 = 4.2 with 5 df: no evidence of bias.
How many degrees of freedom does a 3 × 4 contingency table have?
Show answer
6.
Find the expected count for a cell with row total 50, column total 40 and grand total 200.
Show answer
10.
Of 12 paired comparisons, 10 favour method B. Use the sign test (two-sided).
Show answer
P(X ≥ 10) = 79/4096 = 0.019; two-sided p ≈ 0.039.
What is the chance of at least one false alarm in 10 independent 5% tests?
Show answer
1 − 0.95¹⁰ = 0.40.
What Bonferroni level should each of 8 tests use for an overall 5%?
Show answer
0.00625.
Lesson quiz · 5 questions
Score 60% or more to complete this lesson.
Create a free account to save your progress, take quizzes and earn a certificate.