
SLS-253 · Lesson 8 of 12 · 22 min
Sales per square foot
▶ Video coming soon A video version of this lesson is on the way.
On November 2, 2026, Bev brought a floor plan of the showroom to the numbers morning, with each department shaded a different colour. Juniper & Pine's building in Regina has 40,000 square feet (about 3,700 square metres) of floor space. About 30,000 square feet (about 2,790 square metres) is selling floor; the rest is the warehouse, offices, staff room and loading dock. "Rent, heat, lighting and cleaning cost us about the same for every square foot, whatever we put on it," Bev said. "So the question is what each square foot gives back."
Measuring space productivity
Sales per square foot is net sales for a period, usually a year, divided by the floor area used to make them. It is the most common measure of how productively a retailer uses its space, and it is reported by retailers, landlords, analysts and industry groups. It is simple to calculate and easy to compare, which is both its strength and its weakness.
The first question is which area to use. Gross area includes everything the store occupies: selling floor, stockrooms, offices and washrooms. Selling area includes only the floor where merchandise is displayed and customers shop. Retailers usually measure departments on selling area, and many report whole stores on gross area. A store with a large warehouse will look much less productive on gross area than on selling area, so a comparison is meaningful only if both figures were calculated the same way.
Canadian retailers work in both units. Building plans, leases and many official statistics use square metres, but much of the retail industry, including shopping-centre landlords and industry benchmarks, still quotes rents and sales per square foot. One square metre is about 10.764 square feet, so sales per square metre are about 10.764 times sales per square foot. This lesson works mainly in square feet, as Juniper & Pine's own reports do, and shows square-metre figures alongside.
Worked problem
Juniper & Pine's store productivity
Juniper & Pine had 2025 net sales of 12.4 million dollars, a gross area of 40,000 square feet and a selling area of 30,000 square feet. Find sales per square foot on each basis, and sales per square metre of selling area.
Show solution
- Per gross square foot = 12,400,000 ÷ 40,000 = 310 dollars.
- Per selling square foot = 12,400,000 ÷ 30,000 ≈ 413.33 dollars.
- Per selling square metre ≈ 413.33 × 10.764 ≈ 4,449 dollars.
Answer: The store sold about 310 dollars per gross square foot and about 413 dollars per selling square foot, or about 4,449 dollars per selling square metre.
Productivity by department
Sales per square foot becomes most useful when it is calculated department by department, because it shows where the store's space earns most.
| Department | Selling area (sq ft) | 2025 net sales | Sales per sq ft | Sales per m² |
|---|---|---|---|---|
| Upholstery | 9,000 | 3.6 million | 400 | about 4,306 |
| Case goods | 7,000 | 2.6 million | about 371 | about 3,998 |
| Mattresses | 3,000 | 1.6 million | about 533 | about 5,741 |
| Appliances | 6,500 | 3.7 million | about 569 | about 6,127 |
| Décor and accessories | 4,500 | 0.9 million | 200 | about 2,153 |
| Store | 30,000 | 12.4 million | about 413 | about 4,449 |
On sales alone, appliances are the store's most productive space, followed closely by mattresses. Décor is the least productive by a wide margin. But a store does not pay its bills with sales; it pays them with gross margin. When margin is used instead, the ranking changes.
Gross margin per square foot
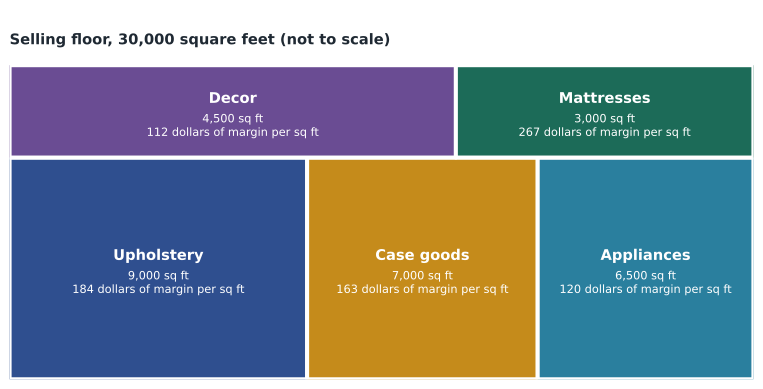
Gross margin per square foot divides a department's gross margin dollars by its selling area. It combines the margin lesson 4 measured with the space this lesson measures, and it is a better guide to which departments deserve more room.
| Department | Gross margin | Gross margin per sq ft | Share of gross margin | Share of selling area | Productivity index |
|---|---|---|---|---|---|
| Mattresses | 0.800 million | about 267 | about 16.4 in 100 | 10 in 100 | about 1.64 |
| Upholstery | 1.656 million | 184 | about 33.9 in 100 | 30 in 100 | about 1.13 |
| Case goods | 1.144 million | about 163 | about 23.4 in 100 | about 23.3 in 100 | about 1.00 |
| Appliances | 0.777 million | about 120 | about 15.9 in 100 | about 21.7 in 100 | about 0.73 |
| Décor and accessories | 0.504 million | 112 | about 10.3 in 100 | 15 in 100 | about 0.69 |
| Store | 4.881 million | about 163 | 100 in 100 | 100 in 100 | 1.00 |
The last column is a space productivity index: a department's share of gross margin divided by its share of selling area. An index of 1.0 means the department earns exactly its fair share of margin for the space it uses. Above 1.0, it earns more than its share; below 1.0, less. Mattresses earn 1.64 times their share. Appliances, which looked best on sales per square foot, drop to 0.73 on margin, because their high sales come with thin margins. Décor is lowest on both measures.
Average and marginal productivity
It is tempting to read the index as a simple instruction: take space from décor and give it to mattresses. Bev warned against doing that mechanically. The figures in the table are averages. The question for a space decision is what the next square foot added or removed would earn, which is usually different.
Mattresses need a certain number of models on display for customers to compare, but beyond that point each extra bed adds little, because customers can lie on only so many in one visit and the market for mattresses in a city is limited. Décor, on the other hand, is partly there to make the furniture look good and to give customers something to add to a sale. Removing décor may lower the sales of the sofas and dining sets it decorates. Retailers therefore treat space changes as experiments: they estimate the effect, try it, and measure what actually happens.
Worked problem
Moving 1,000 square feet
Noura proposes moving 1,000 square feet from décor to mattresses. She estimates that the space removed from décor, its least productive area, earns about 60 in 100 of the department's average sales per square foot. She estimates that the extra mattress space would also earn about 60 in 100 of the mattress average, because the best-selling models are already displayed. Using 2025 margins, estimate the change in gross margin.
Show solution
- Décor sales lost = 1,000 × 200 × 0.60 = 120,000 dollars; margin lost = 120,000 × 0.56 = 67,200 dollars.
- Mattress sales gained ≈ 1,000 × 533.33 × 0.60 ≈ 320,000 dollars; margin gained ≈ 320,000 × 0.50 = 160,000 dollars.
- Net change ≈ 160,000 − 67,200 = 92,800 dollars.
Answer: On these estimates, the move would add about 92,800 dollars of gross margin a year. The result depends heavily on the 60 in 100 assumptions, so Bev agreed to try a smaller version first: 400 square feet for an adjustable-base mattress gallery from January 2027, measured over three months.
The test also had to consider what lesson 7 called the other measures. More mattress space means more mattress models and more inventory, which could lower the department's turn and GMROI. A good space decision looks at sales and margin per square foot, GMROI and the effect on neighbouring departments together.
Space in time and in height
Sales per square foot is normally an annual figure, but space is also sold by the week. A holiday display near the entrance earns far more per square foot in December than in February. Retailers plan seasonal changes to the floor accordingly: Juniper & Pine moves outdoor furniture to the front in spring, extends the appliance gallery in November and enlarges the décor area for the holidays.
Floor area also understates the space available. Walls, shelving and tall fixtures add display space without adding floor. Retailers who sell small goods often measure linear feet of shelf rather than square feet of floor. Juniper & Pine measures its décor wall in linear feet and found in 2025 that the top shelves, above eye level, sold less than a third as much per foot as the shelves between waist and eye height. Noura moved the slowest lines up and the best sellers into the middle, which is a free way to raise productivity.
Benchmarks and comparisons
Industry figures for sales per square foot are widely quoted, but they vary enormously by type of store and are often calculated on different bases. A jewellery or electronics store can sell several thousand dollars per square foot; a furniture store, which needs room to display large items, typically sells much less. Comparing Juniper & Pine with a grocery store or a mall clothing store would tell it nothing useful. The most useful comparisons are with the store's own history, with its plan and with similar furniture and appliance retailers when reliable figures are available.
Bev also reminded the group that sales per square foot can be raised in bad ways. Crowding the floor with more products may raise sales per square foot for a while but make the store harder to shop, and customers buying a sofa want room to see it from all sides and sit on it. The Visual Merchandising and the Store Environment course covers the layout side of this question.
Does each square foot pay its way?
Gross margin per square foot shows what each part of the floor earns. To know whether it earns enough, compare it with what the space costs. Every square foot of selling floor has to carry its share of the store's operating expenses: rent and occupancy, wages, delivery, advertising and the rest. Dividing operating expenses by selling area gives a rough break-even line.
Worked problem
Margin and expenses per square foot
Juniper & Pine's 2025 operating expenses were 4.26 million dollars and its selling area was 30,000 square feet. Compare each department's gross margin per square foot with the store's operating expenses per square foot.
Show solution
- Operating expenses per selling square foot = 4,260,000 ÷ 30,000 = 142 dollars.
- Store gross margin per square foot ≈ 162.70 dollars, leaving about 20.70 dollars of operating profit per square foot (620,000 ÷ 30,000 ≈ 20.67).
- Mattresses: about 266.70 − 142 ≈ 124.70 dollars above the line.
- Upholstery: 184 − 142 = 42 dollars above.
- Case goods: about 163.40 − 142 ≈ 21.40 dollars above.
- Appliances: about 119.50 − 142 ≈ −22.50 dollars, below the line.
- Décor: 112 − 142 = −30 dollars, below the line.
Answer: On an average-cost basis, mattresses, upholstery and case goods cover their share of expenses with room to spare. Appliances and décor do not.
This comparison is rough, because expenses are not really spread evenly. Décor needs little delivery and almost no installation; appliances need a great deal of both. A store that allocates each expense to the department that causes it, rather than by floor area, gets a more accurate picture. Even so, the comparison raised a fair question, which Bev put to the group: what does décor do for the store that does not show up in its own numbers? The answer, in part, was that décor makes the sofas and dining sets look like rooms customers want to live in, and that customers add a lamp or rug to a third of upholstery sales. A department can be worth its space for what it does for others, but that claim should be tested, not assumed.
Occupancy costs are often quoted by landlords per square foot per year, even in Canada. A store paying an occupancy cost of 18 dollars per square foot a year on its 40,000-square-foot building pays 720,000 dollars a year for its space. Spread over 30,000 square feet of selling floor, that is 24 dollars for every selling square foot (about 258 dollars per square metre) before a single employee is paid.
Common mistakes
MistakeComparing sales per square foot calculated on gross area with figures on selling area.
InsteadCheck which area was used and convert to the same basis.
MistakeRanking departments on sales per square foot alone.
InsteadUse gross margin per square foot and the productivity index too.
MistakeMoving space based on average productivity.
InsteadEstimate what the space being moved would actually earn, and test before committing.
MistakeIgnoring the effect of a change on neighbouring departments.
InsteadConsider traffic, adjacencies and items bought together.
MistakeCrowding the floor to raise productivity.
InsteadKeep the store easy to shop; productivity built on clutter does not last.
Summary and key terms
- Sales per square foot is net sales divided by floor area; gross area includes stockrooms and offices, selling area only the shopping floor.
- One square metre is about 10.764 square feet, so sales per square metre are about 10.764 times sales per square foot.
- Juniper & Pine sold about 413 dollars per selling square foot (about 4,449 dollars per square metre) in 2025.
- By department, appliances and mattresses had the highest sales per square foot and décor the lowest.
- Gross margin per square foot is a better guide to space decisions; on that measure mattresses lead and appliances fall well behind.
- The space productivity index divides a department's share of gross margin by its share of space.
- Space decisions should use estimates of what the space being moved would earn, not averages, and should be tested.
- Wall and shelf space, measured in linear feet, adds capacity without adding floor.
- Benchmarks are useful only between similar stores calculated the same way.
- Sales per square foot
- Net sales for a period divided by floor area.
- Gross area
- All the floor space a store occupies, including stockrooms and offices.
- Selling area
- The floor space where merchandise is displayed and customers shop.
- Gross margin per square foot
- Gross margin dollars divided by selling area.
- Space productivity index
- A department's share of gross margin divided by its share of selling area.
- Linear feet
- Length of shelf or wall display, used to measure space for small goods.
Practice problems
Work each problem on paper first, then reveal the answer to check.
A store sells 6 million dollars a year on 15,000 square feet of selling area. What are its sales per square foot?
Show answer
6,000,000 ÷ 15,000 = 400 dollars.
A department earns 25 in 100 of the store's gross margin on 20 in 100 of its selling area. What is its productivity index?
Show answer
25 ÷ 20 = 1.25.
A store sells 3,500 dollars per square metre. What is that per square foot?
Show answer
3,500 ÷ 10.764 ≈ 325 dollars per square foot.
Lesson quiz · 5 questions
Score 60% or more to complete this lesson.
Create a free account to save your progress, take quizzes and earn a certificate.