
SLS-252 · Lesson 12 of 12 · 22 min
Case study: a store with high shrink
▶ Video coming soon A video version of this lesson is on the way.
Juniper & Pine's January 2026 count delivered one result that nobody liked: the décor department had lost 23,400 dollars of merchandise at retail in 2025, a shrink rate of 2.6 in 100 of its 900,000 dollars of sales, more than three times the rest of the store. Bev gave Marcus the job of finding out why and fixing it. By the time Aiden joined the back-room sessions in September, the work had been under way for seven months, and on Friday, November 13, 2026, Marcus walked the group through the whole case from start to finish. "Every store has a department like this," he said. "The question is whether you guess at it or work it out." This lesson follows his case: the problem, the evidence, the causes, the plan, the results so far and what comes next.
Step 1: Define the problem
A good shrink investigation starts by stating the problem precisely, with numbers, so that progress can be measured. Marcus's problem statement, written in February 2026, was one paragraph long.
"In 2025, décor shrink was 23,400 dollars at retail, 2.6 in 100 of the department's net sales, compared with 0.7 in 100 for the rest of the store. Décor is 7 in 100 of store sales but produced about 24 in 100 of store shrink. At the department's 56 in 100 gross margin, the loss at cost was about 10,300 dollars. The goal is to bring décor shrink below 1.5 in 100 by the January 2027 count without reducing décor sales."
Worked problem
The size of the décor problem
Using the figures in the problem statement, check the rest-of-store shrink rate and the décor loss at cost.
Show solution
- Store shrink = 99,000 dollars on 12,400,000 dollars of sales.
- Rest of store: shrink 99,000 − 23,400 = 75,600 dollars on sales of 12,400,000 − 900,000 = 11,500,000 dollars.
- \[\text{Rest-of-store shrink rate} = \frac{75{,}600}{11{,}500{,}000} \approx 0.0066\]
- Décor loss at cost = 23,400 × (1 − 0.56) ≈ 10,296 dollars.
Answer: The rest of the store ran at about 0.66 in 100, which rounds to the 0.7 in 100 in the statement, and the décor loss at cost was about 10,300 dollars. Stating the goal as a rate (below 1.5 in 100) keeps it fair if sales change.
Two details in the statement mattered. First, it said the goal had to be met without cutting sales, because the easy way to stop décor theft, putting everything behind glass, would also stop décor selling. Second, it gave a date, the next full count, when the result would be measured.
Step 2: Gather the evidence
Marcus did not assume the cause. He collected evidence from every source the store already had, which took about three weeks in February and March 2026.
| Source | What Marcus looked for | What he found |
|---|---|---|
| Count results by item | Which décor items had the largest shortages | Table lamps, small mirrors, candles and throws: 64 in 100 of the shortage value |
| Incident reports | Known thefts in 2025 | 19 incidents, 31 items, 3,120 dollars at retail, mostly lamps and mirrors from the front display |
| Inventory adjustments | Write-offs and their reasons | Only 1,150 dollars of damage written off all year, far less than the breakage staff described |
| Receiving records | Shortages on décor deliveries | Several cartons recorded as full cases when they were short |
| POS exception reports | No-receipt returns, voids and discounts in décor | No-receipt returns of décor up sharply in the second half of 2025 |
| Camera footage | Blind spots and patterns | The front display could not be seen from the cash counter |
| Staff interviews | What associates saw and did | Broken vases often thrown out "to keep the floor tidy"; décor left unstaffed on busy Saturdays |
Each source on its own was suggestive. Together they pointed to three causes, not one: theft from the front display, unrecorded damage, and receiving and returns errors. The most useful pieces of evidence were the cheapest to collect: the adjustment report and a conversation with the décor team.
Step 3: Estimate the causes
Because most shrink is never directly observed, Marcus estimated how much each cause contributed. He was clear that these were estimates built from the evidence, not measurements, and he wrote down how he made each one.
| Cause | How it was estimated | Estimated share | Estimated amount (retail) |
|---|---|---|---|
| Theft from the floor | Known thefts were 3,120 dollars; staff and camera review suggested most thefts went unnoticed; items with the largest shortages were the most stolen | About 60 in 100 | About 14,000 dollars |
| Unrecorded damage | Staff estimates of breakage, compared with the 1,150 dollars actually written off | About 25 in 100 | About 5,850 dollars |
| Receiving and returns errors | Shortages found when cases were opened, and no-receipt returns of items not recently sold | About 15 in 100 | About 3,500 dollars |
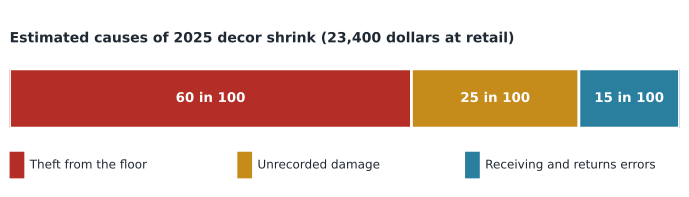
The estimate changed the plan. If Marcus had assumed all the shrink was theft, he would have bought an EAS system and stopped there. The evidence said that about 40 in 100 of the loss came from things no tag or camera would fix.
Step 4: Build the plan
Marcus's plan, approved by Bev in March 2026, matched an action to each cause and gave each one an owner and a date.
| Cause | Action | Owner | Start |
|---|---|---|---|
| Theft | Move lamps and small mirrors from the front display to a table in view of the counter | Noura Saleh | April 2026 |
| Theft | Display one or two samples of small high-value items; keep the rest behind the counter | Noura Saleh | April 2026 |
| Theft | Lower décor shelving so the counter can see across the department | Marcus Dube | May 2026 |
| Theft | Assign one associate to décor on every Saturday and Sunday | Bev Halvorsen | April 2026 |
| Theft | Greeting standard: every shopper acknowledged within about a minute | Bev Halvorsen | April 2026 |
| Damage | Damage log at the décor counter; nothing thrown away without a write-off entry | Marcus Dube | March 2026 |
| Damage | Sturdier risers and edge lips on glass and ceramic displays | Noura Saleh | May 2026 |
| Receiving | Open and count décor cartons by unit, not by case, on the day received | Marcus Dube | March 2026 |
| Returns | No-receipt returns only with manager approval, ID, store credit and a yearly limit | Bev Halvorsen | April 2026 |
| All | Monthly cycle counts of décor A items, with root-cause review of every variance | Marcus Dube | April 2026 |
Most of the actions cost almost nothing: moving a table, writing a log, changing a policy. The two with real costs were the weekend staffing, about 8,000 dollars a year in extra hours, and the new risers, about 1,400 dollars. EAS was left for later, as lesson 6 described, because its payback at cost was about five years on décor alone.
Marcus also decided what not to do. He did not lock up candles or throws, because they sell partly on impulse, and he did not add cameras aimed at staff, because the evidence did not point to internal theft and the team's cooperation was essential to the plan.
Step 5: Measure the results
A full count happens only once a year, but Marcus did not want to wait until January to know whether the plan was working. On Sunday, October 4, 2026, before the store opened, the warehouse team and an outside counter did a department count of décor alone. It compared the book and physical inventory for the period since the January count.
Worked problem
Annualizing the October décor count
The October 4 décor count covered the period from the January 2026 count to October 3, 2026, during which décor net sales were 610,000 dollars. Book inventory at retail was 152,400 dollars and physical inventory was 142,600 dollars. What was the shrink rate for the period, and how does it compare with 2025?
Show solution
- Shrink = 152,400 − 142,600 = 9,800 dollars at retail.
- \[\text{Shrink rate} = \frac{9{,}800}{610{,}000} \approx 0.0161\]
- Compare with 2025: 2.6 in 100.
Answer: Décor shrink for the period was about 1.6 in 100 of sales, down from 2.6 in 100 in 2025, but still above the goal of below 1.5 in 100. Because the rate is measured against sales for the same period, it can be compared directly with the full-year rate.
Worked problem
What the improvement is worth
If décor sells about 900,000 dollars a year and shrink falls from 2.6 to 1.6 in 100 of sales, how much less is lost each year at retail and at cost (gross margin 56 in 100)? How does that compare with the 8,000 dollars a year of extra weekend staffing?
Show solution
- Reduction = (0.026 − 0.016) × 900,000 = 0.010 × 900,000 = 9,000 dollars at retail.
- At cost: 9,000 × (1 − 0.56) = 3,960 dollars.
Answer: The store loses about 9,000 dollars less at retail, or about 3,960 dollars at cost, each year. That alone does not pay for 8,000 dollars of extra staffing, but the staffing also sells: Bev's figures showed décor weekend sales up about 6 in 100 compared with 2025, about 15,000 dollars a year more in sales and about 8,400 dollars more in gross margin at 56 in 100. Together, the shrink saving and the extra margin more than cover the cost.
Marcus looked at the October results by cause too. Recorded damage write-offs had risen to 2,900 dollars for the period, which looked bad at first glance but was a sign the damage log was working: losses that used to become unexplained shrink were now being recorded. Receiving shortages found at the dock had risen for the same reason. The items most often stolen in 2025, lamps and small mirrors, showed the largest drop in unexplained shortages.
Step 6: Keep going
Shrink programs fail most often not at the start but six months later, when attention moves elsewhere and old habits come back. Marcus's plan for the rest of 2026 and early 2027 was designed to keep the gains.
- Report monthly. A one-page décor shrink report to Bev each month: cycle count variances, damage write-offs, incidents and no-receipt returns.
- Keep the routines visible. The damage log stays at the counter, the weekend décor assignment stays on the schedule, and the greeting standard is part of Bev's Thursday floor school.
- Prepare for the holidays. Extra staffing in décor for Black Friday and December, and a review of the front display before holiday merchandise arrives.
- Decide on EAS after the count. If the January 2027 count shows décor still above 1.5 in 100, revisit tagging high-value décor at the front entrance.
- Share what worked. Apply the same approach to the next highest shrink area, upholstery, where the evidence pointed to receiving and sales-entry errors on multi-piece sectionals rather than theft.
The final measure will come from the January 2027 full count, planned for the last weekend of the month. Marcus's forecast, written as a plan rather than a promise, was décor shrink of about 1.4 to 1.6 in 100 for the full year.
What the case teaches
The décor case followed a pattern that works for most operations problems, not only shrink.
| Step | What to do | In the décor case |
|---|---|---|
| Define | State the problem with numbers, a goal and a date | 2.6 in 100 in 2025; below 1.5 in 100 by the January 2027 count |
| Gather | Collect evidence from every existing source | Counts, incidents, adjustments, receiving, POS reports, cameras, staff |
| Estimate | Estimate the causes and show how | About 60 theft, 25 damage, 15 receiving and returns |
| Plan | Match actions to causes, with owners and dates; decide what not to do | Ten actions, mostly low cost; EAS deferred |
| Measure | Check results before the year ends | October department count: 1.6 in 100 |
| Sustain | Report, keep routines visible, extend to the next problem | Monthly report; upholstery next |
Aiden asked Marcus what he would have done differently. "Talked to the décor team sooner," Marcus said. "I spent two weeks on reports before I asked the people who work there every day. They told me about the broken vases in ten minutes."
Common mistakes
MistakeAssuming high shrink in a theft-prone department must all be theft.
InsteadGather evidence; damage, receiving and returns errors may be a large share.
MistakeFixing shrink by locking everything up.
InsteadProtect selectively, and make sure sales are part of the goal.
MistakeWaiting a full year to see whether a plan works.
InsteadUse cycle counts or a department count to measure progress during the year.
MistakeReading a rise in recorded damage as failure.
InsteadWhen losses start being recorded rather than lost, recorded damage rises and unexplained shrink falls.
MistakeMoving on once the numbers improve.
InsteadKeep reporting and keep the routines, or the old habits return.
Summary and key terms
- Juniper & Pine's décor department had 2025 shrink of 23,400 dollars, 2.6 in 100 of its sales against 0.7 in 100 for the rest of the store.
- Marcus defined the problem with numbers, a goal of below 1.5 in 100 by the January 2027 count and a condition that sales must not suffer.
- He gathered evidence from count results, incident reports, adjustments, receiving records, POS exception reports, camera footage and staff, and estimated that about 60 in 100 of the loss was theft, 25 in 100 unrecorded damage and 15 in 100 receiving and returns errors.
- The plan matched low-cost actions to each cause, with owners and dates, and deferred EAS.
- An October department count showed shrink of about 1.6 in 100 for the period, worth about 9,000 dollars a year at retail.
- Rising recorded damage showed the damage log was working.
- The approach of define, gather, estimate, plan, measure and sustain applies to most operations problems, and the people who do the work are often the best source of evidence.
- Problem statement
- A short, measurable description of a problem, its goal and its deadline.
- Department count
- A physical count of one department between full counts.
- Root cause
- The underlying reason a problem occurs, as opposed to its symptoms.
- Action plan
- A list of actions matched to causes, each with an owner and a date.
- Unexplained shrink
- Shrink not accounted for by recorded write-offs or known incidents.
- Recorded damage
- Damage entered as a write-off when it happens, so it is not shrink.
- Sustaining
- Keeping improvements in place after the initial effort ends.
- Evidence matrix
- A table that lists each source of evidence and what it shows.
Practice problems
Work each problem on paper first, then reveal the answer to check.
A department's book inventory at retail is 80,000 dollars and its physical inventory is 77,600 dollars, for a period with sales of 150,000 dollars. What is the shrink rate?
Show answer
Shrink = 2,400 dollars; 2,400 ÷ 150,000 = 0.016, or 1.6 in 100.
Shrink falls from 2.0 to 1.2 in 100 on sales of 500,000 dollars, with a gross margin of 50 in 100. How much is saved at retail and at cost each year?
Show answer
0.008 × 500,000 = 4,000 dollars at retail; 2,000 dollars at cost.
Why did recorded damage rise after the plan started, and why was that good news?
Show answer
Staff began logging broken items instead of throwing them away, so losses that used to be unexplained shrink were now recorded and could be managed.
Lesson quiz · 5 questions
Score 60% or more to complete this lesson.
Create a free account to save your progress, take quizzes and earn a certificate.