
ROB-499 · Lesson 8 of 12 · 28 min
Verification, validation and testing
A capstone's claims are only as strong as its evidence. Verification asks whether the robot was built right: does it meet each requirement? Validation asks whether the right robot was built: does it meet the stakeholders' actual needs in the real setting? Both rely on testing, but testing a robot is expensive, outdoor tests depend on weather, and the number of trials a team can afford is small. This lesson covers how to plan verification and validation, how to choose sample sizes and report results with honest uncertainty, how to combine simulation, hardware-in-the-loop and field testing, and how to run regression testing so that late changes do not quietly break earlier work. ROB-360 lessons 4 and 8 covered software testing and hardware-in-the-loop methods; this lesson applies them at the system level.
The V-model and verification methods
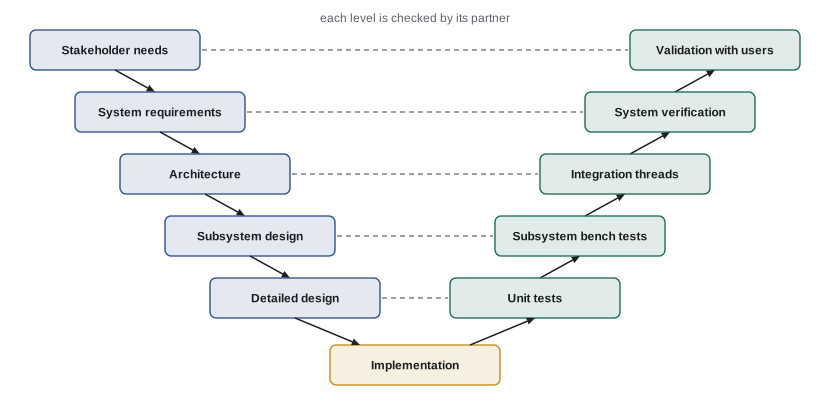
The V-model pictures development as a V: the left side descends from stakeholder needs through system requirements and architecture to detailed design; the bottom is implementation; the right side ascends through unit tests, subsystem tests and system verification to validation. Each level on the right verifies the matching level on the left. The practical lesson is that test planning for each level should happen when that level is designed, not after it is built. The test plan presented at PDR covers system verification; subsystem test plans are ready by CDR.
Four verification methods are standard. Inspection examines the item directly, such as weighing the robot to verify the mass limit or checking that the bin accepts the standard bag. Analysis uses calculation or simulation, such as verifying battery runtime from measured power and capacity, or verifying arm mount strength. Demonstration operates the system to show a function works without detailed measurement, such as showing the report export. Test operates the system under controlled conditions and measures performance against a quantitative criterion, such as detection recall or stopping distance. The verification matrix, an extension of the traceability matrix from lesson 2, records the method, procedure, result and status for each requirement.
How many trials?
Requirements such as "the robot shall stop within 0.5 m in 19 of 20 trials" or "grasp success of at least 70 per cent" are probabilistic, and a handful of successes does not prove them. Suppose a team wants to show, with confidence \( C \), that a binary function has a reliability of at least \( R \). If every trial succeeds, the minimum number of trials comes from the success-run theorem:
To show 90 per cent reliability with 90 per cent confidence and zero failures needs 22 trials; to show 95 per cent reliability with 95 per cent confidence needs 59. These numbers surprise most teams, and they are the reason lesson 1 recommended planning testing from early in the term. When some trials fail, which is normal, the result should be reported as an estimate with a confidence interval rather than a bare percentage. The Wilson score interval behaves well for the small samples typical of capstones and does not produce impossible bounds below 0 or above 100 per cent:
where \( x \) is the number of successes in \( n \) trials and \( z \) is the standard normal value for the chosen confidence, 1.96 for 95 per cent.
# Planning and reporting binary tests: success-run sample sizes and Wilson intervals
import math
def success_run_n(R, C):
    return math.ceil(math.log(1 - C) / math.log(R))
for R, C in [(0.90, 0.90), (0.95, 0.90), (0.95, 0.95), (0.99, 0.95)]:
    print(f"show R >= {R:.2f} at {C:.0%} confidence with zero failures: {success_run_n(R, C)} trials")
def wilson(x, n, z=1.96):
    mid = (x + z * z / 2) / (n + z * z)
    half = z / (n + z * z) * math.sqrt(x * (n - x) / n + z * z / 4)
    return mid - half, mid + half
results = {  # requirement: (successes, trials, target)
    "R3 grasp cans (target 0.70)":         (31, 40, 0.70),
    "R5 protective stop (target 0.95)":    (40, 40, 0.95),
    "R2 detect cans/caps (target 0.80)":   (101, 120, 0.80),
    "R7 grasp wrappers (target 0.50)":     (6, 24, 0.50),
}
for name, (x, n, target) in results.items():
    lo, hi = wilson(x, n)
    verdict = "met" if lo >= target else "not met" if hi < target else "inconclusive"
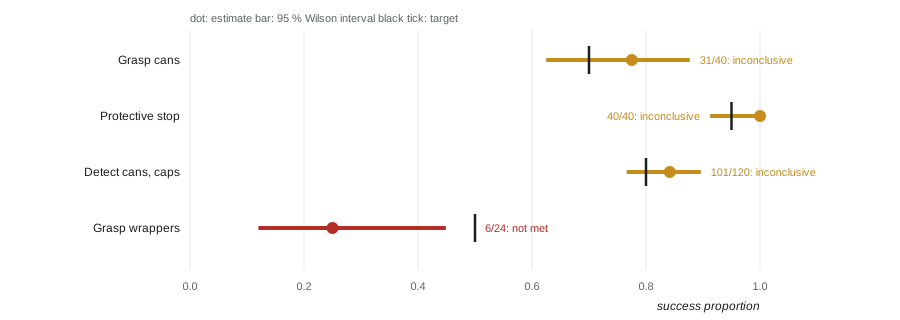
print(f"{name:36s} {x}/{n} = {x/n:.0%} 95% CI [{lo:.2f}, {hi:.2f}] -> {verdict}")show R >= 0.90 at 90% confidence with zero failures: 22 trials show R >= 0.95 at 90% confidence with zero failures: 45 trials show R >= 0.95 at 95% confidence with zero failures: 59 trials show R >= 0.99 at 95% confidence with zero failures: 299 trials R3 grasp cans (target 0.70) 31/40 = 78% 95% CI [0.62, 0.88] -> inconclusive R5 protective stop (target 0.95) 40/40 = 100% 95% CI [0.91, 1.00] -> inconclusive R2 detect cans/caps (target 0.80) 101/120 = 84% 95% CI [0.77, 0.90] -> inconclusive R7 grasp wrappers (target 0.50) 6/24 = 25% 95% CI [0.12, 0.45] -> not met
The results show three different outcomes. The protective stop passed all 40 trials; its lower bound of about 0.91 is below the 0.95 target, so strictly the data are consistent with, but do not prove, the requirement at 95 per cent confidence; 59 consecutive successes would. Can grasping achieved 78 per cent, and although that is above the 70 per cent target, the lower bound of the interval is below it, so the honest verdict is inconclusive rather than met. Detection, with 120 trials, has a narrower interval but its lower bound also falls below the target. Wrapper grasping clearly falls short: even the upper bound of its interval is below the 50 per cent target. Reporting results this way is more work than writing "78 per cent, requirement met", but it is what an examiner, a partner or a safety reviewer needs. It also tells the team where more trials would change the verdict and where they would not.
For continuous measurements, such as stopping distance, positioning error or patrol time, report the mean, standard deviation, the worst case and, where the requirement concerns a limit, the proportion of trials within the limit. Plot distributions rather than reporting only averages; a mean stopping distance of 0.32 m hides the one trial at 0.61 m that matters most. ROB-430 lesson 9 covered statistical analysis of user studies, which applies directly when validation involves people.
Simulation, hardware-in-the-loop and field tests
Each test environment trades realism against cost and repeatability. Simulation is cheap, fast, repeatable and safe, and it can run thousands of scenarios overnight in continuous integration, but it misses real sensor noise, sand traction and sunlight. Hardware-in-the-loop testing, covered in ROB-360 lesson 8, runs real components, such as the microcontroller and motor drivers, against simulated inputs; it catches timing and interface faults. Controlled lab or test-area trials use the real robot in a prepared environment, such as a sand pit with seeded litter, and offer good repeatability. Field tests in the real environment are the most realistic and the only way to validate, but they are expensive, weather-dependent and hard to repeat.
A sensible test strategy uses each environment for what it does best. Team Tern ran navigation regression tests in simulation on every merge, used the department's sand pit for most grasping and stopping trials because conditions could be controlled and repeated, and reserved four field days at the beach for detection performance, full patrols and validation with parks staff. Field days were planned like experiments, with procedures, data sheets, roles and a weather backup date, because a wasted field day is hard to replace.
| Environment | Strengths | Limitations | Tern's main uses |
|---|---|---|---|
| Simulation | Cheap, fast, repeatable, safe, automatable | Model gaps: sensors, terrain, lighting | Navigation regression on every merge; edge-case scenarios |
| Hardware-in-the-loop | Real electronics and timing with simulated world | Limited to the components in the loop | Firmware watchdog and safety input tests |
| Controlled test area | Real robot, repeatable conditions | Not the real environment | Grasp and stopping trials in the sand pit |
| Field | Realistic; only place for validation | Expensive, variable, weather-dependent | Detection, full patrols, user validation |
Writing and running test procedures
A test procedure is a script that someone else could follow to reproduce the test. It states the requirement being verified, the configuration to use, the setup including the test area and any seeded objects, the step-by-step actions, the data to record, the pass criterion and the safety precautions. Writing procedures before testing forces decisions that would otherwise be improvised, such as how cans are placed (randomly from a table of positions, not where the operator chooses) and what counts as a success (the can in the bin, not merely lifted).
Good tests control for bias. If the person who wrote the grasp planner also places the cans, they may unconsciously place them in easy positions. Randomizing positions and orientations from a pre-generated table, separating the roles of operator and recorder, and fixing the success criterion beforehand all reduce bias. Every trial is recorded, including failures and aborted runs, with the reason. Selectively reporting the best runs is a form of misconduct, and examiners generally recognize it.
Worked problem
Planning the protective-stop verification
Requirement R5 says Tern shall stop within 0.5 m of a person entering its protective field. The team wants to show at least 95 % reliability with 90 % confidence. How many trials are needed, and how should they be run?
Show solution
- Zero-failure trials needed: \( n = \ln(0.10)/\ln(0.95) \approx 44.9 \), so 45 trials.
- Use a test object representing a leg, such as a 70 mm diameter cylinder of standard height, moved into the field at walking speed from random directions selected from a table.
- Run at the maximum patrol speed and at the approach speed, on flat sand and on the 10-degree slope, distributing the 45 trials across these conditions.
- Measure stopping distance with a tape and video at known frame rate; record every trial, including any where the object was not detected.
- If any trial fails, stop, analyse the cause, fix it and restart the count; report the Wilson interval for all trials.
Answer: Forty-five consecutive successes across the planned conditions; any failure triggers a root-cause analysis and a new series, with all trials reported.
Regression testing
Late in the term, every fix risks breaking something that previously worked. Regression testing re-runs a set of tests after each change to catch such breakage. Software regression tests run automatically in continuous integration; hardware regression tests are a short, fixed checklist run at the start of each test day, such as the emergency stop, protective stop, a 20 m waypoint run and three grasps. Tracking the pass rate of the regression suite over time shows whether the system is converging or becoming less stable.
# Tracking regression test pass rate over the last weeks of term (illustrative records)
import numpy as np
week   = np.array([8, 8, 9, 9, 9, 10, 10, 10, 11, 11, 12, 12])
passed = np.array([31, 33, 30, 25, 34, 35, 36, 29, 39, 39, 40, 40])
total  = np.array([36, 36, 38, 38, 38, 40, 40, 40, 41, 41, 41, 41])
rate = passed / total
for w in np.unique(week):
    m = week == w
    print(f"week {w}: runs {m.sum()}, pass rate {rate[m].mean():.0%} (min {rate[m].min():.0%})")
slope = np.polyfit(np.arange(len(rate)), rate, 1)[0]
print(f"trend {slope * 100:+.1f} percentage points per run; last 4 runs all >= 95 %: {bool((rate[-4:] >= 0.95).all())}")week 8: runs 2, pass rate 89% (min 86%) week 9: runs 3, pass rate 78% (min 66%) week 10: runs 3, pass rate 83% (min 72%) week 11: runs 2, pass rate 95% (min 95%) week 12: runs 2, pass rate 98% (min 98%) trend +1.4 percentage points per run; last 4 runs all >= 95 %: True
Dips in the record, such as the one in week 9 and the one in week 10, each correspond to a change that broke something; the integration log shows that the first was a tf frame rename and the second a new gripper firmware. The upward trend and the stable final runs give the team confidence to freeze the configuration for the demonstration. A common rule is a feature freeze about a week before the final demonstration, after which only bug fixes that pass the full regression suite are allowed.
Validation with stakeholders
Verification can show that every requirement is met and the robot can still fail its users. Validation tests the robot in the real setting with real users and asks whether it meets the needs. Team Tern's validation involved two parks staff members operating Tern after 30 minutes of training, completing a patrol, reviewing the report, and answering a short structured questionnaire and an interview about usefulness, ease of use and concerns. The team also observed beach visitors' reactions from a distance. The staff found the report valuable, wanted a simpler start-up sequence, and noted that Tern collected cans well but missed many cigarette butts, which are the most common beach litter item and were not in the requirements. That last finding is exactly the kind of insight validation exists to produce; it went into the recommendations for future work.
If validation involves collecting data from people, such as questionnaires, interviews or video of beach visitors, and the results will be used as research, it may require review by your institution's research ethics board under the Tri-Council Policy Statement (TCPS 2). Activities done solely for quality assurance or course evaluation are often exempt, but the board, not the team, decides; lesson 9 explains the process.
Common mistakes
MistakeDeclaring a probabilistic requirement met after a few successful trials.
InsteadUse the success-run theorem to plan sample sizes and report results with confidence intervals.
MistakeReporting only a bare percentage such as 78 % success.
InsteadReport successes, trials and a Wilson interval, and state whether the requirement is met, not met or inconclusive.
MistakeReporting averages only for continuous measures.
InsteadReport the distribution, worst case and proportion within limits, with plots.
MistakeLetting the designer choose test conditions informally.
InsteadRandomize conditions from pre-generated tables, separate operator and recorder roles and fix success criteria beforehand.
MistakeReporting only the best runs.
InsteadRecord and report every trial, including failures and aborts with reasons.
MistakeChanging the system right up to the demonstration.
InsteadRun regression tests after every change and apply a feature freeze about a week before the demonstration.
Summary and key terms
- Verification checks requirements were met; validation checks stakeholder needs are met in the real setting.
- The V-model links each design level to a matching test level; test plans are written when designs are made.
- Inspection, analysis, demonstration and test are the standard verification methods, tracked in a verification matrix.
- The success-run theorem gives zero-failure sample sizes; Wilson intervals report binary results honestly.
- Simulation, hardware-in-the-loop, controlled test areas and field tests each have roles in a test strategy.
- Written procedures, randomization, role separation and complete records reduce bias.
- Regression testing and a feature freeze protect a converging system; validation with users reveals unmet needs.
- Verification
- Confirming that a system meets its specified requirements.
- Validation
- Confirming that a system meets stakeholder needs in its intended environment.
- V-model
- A development model pairing each design level with a corresponding test level.
- Verification matrix
- A table recording the verification method, procedure, result and status for each requirement.
- Success-run theorem
- A formula giving the number of consecutive successes needed to show a reliability at a confidence level.
- Wilson score interval
- A confidence interval for a proportion that behaves well with small samples.
- Hardware-in-the-loop
- Testing real hardware components against simulated inputs and environments.
- Test procedure
- A written, reproducible script for running a test and recording its results.
- Regression testing
- Re-running tests after changes to detect newly introduced faults.
- Feature freeze
- A point after which no new features are added, only verified fixes.
Practice problems
Work each problem on paper first, then reveal the answer to check.
Distinguish verification and validation with a Tern example of each.
Show answer
Verification: testing that the protective stop meets 0.5 m; validation: parks staff using Tern on the beach and judging whether it reduces their work.
Which verification method suits the 25 kg mass limit?
Show answer
Inspection, by weighing the robot.
How many consecutive successes show 90 % reliability at 95 % confidence?
Show answer
\( \ln(0.05)/\ln(0.90) \approx 28.4 \), so 29 trials.
A test gives 18 successes in 20 trials. Why is "90 %, requirement of 85 % met" an overstatement?
Show answer
The Wilson 95 % interval is roughly 0.70 to 0.97, so the data cannot confirm the true rate is at least 85 %.
Why plot stopping distances rather than report the mean?
Show answer
The mean can hide rare long stops that matter most for safety; the distribution and worst case show them.
Give two ways to reduce bias in grasp testing.
Show answer
Randomize item positions from a pre-generated table and have someone other than the planner's author place items and record outcomes.
Why is the sand pit useful even though validation must happen at the beach?
Show answer
It provides repeatable controlled conditions for many trials at low cost, leaving field days for what only the field can show.
What should a daily hardware regression checklist include for Tern?
Show answer
For example: emergency stop, protective stop, a short waypoint run and a few grasps.
What does a dip in the regression pass rate usually indicate?
Show answer
A recent change broke previously working behaviour; the integration log should identify it.
Why was the cigarette-butt finding valuable even though it was not a requirement?
Show answer
Validation revealed an unmet stakeholder need, informing future work and showing the limits of the requirements.
Lesson quiz · 5 questions
Score 60% or more to complete this lesson.
Create a free account to save your progress, take quizzes and earn a certificate.