
RAC-410 · Lesson 12 of 12 · 17 min
Plant optimization: the capstone retrofit study
In February, a year into the contract, Grace asked Northfield for one more thing: a study of everything they had learned about the plant, turned into a list of improvements with costs and savings that she could take to the hospital's board. The hospital had a target to cut its energy use and emissions, and CH-1, at seventeen years old and using R-134a, was on the capital plan for replacement. "I need to know what to do first," she said, "and whether replacing CH-1 is the best use of the money." Raj gave Theo the job of drafting it, with Dana reviewing. It was the biggest report Theo had written, and it pulled together the whole course.
This lesson works through that study: gathering the data, identifying the measures, estimating savings, ranking them and presenting the result. The method applies to any plant, and the habits it uses, measuring first, finding causes, and comparing options honestly, are the ones the course has tried to build.
Starting from measurements
A plant study is only as good as its data. Theo had a year of it: the plant's electricity and cooling meters from lesson 1, the building automation trends from lesson 7 and lesson 9, the chiller logs and approaches from lesson 10, the outage reports from lesson 11, the water treatment records from lesson 6 and the pump measurements from lesson 8. He organized it into a baseline: how much cooling the plant delivered in each season, how much electricity each part used, and how efficiently. The baseline whole-plant efficiency, including pumps and towers, matched the estimate in lesson 1 within a few per cent, which gave him confidence in the meters.
The study also listed what could not be measured directly and had to be estimated, with the method stated: for example, the savings from fixing low delta-T, which depended on how many hours the plant would run one chiller instead of two. Dana's rule for the report was that every number should say where it came from.
The measures
From a year's findings, Theo listed five measures, from cheapest to most expensive:
- Re-sequencing and reset. Make CH-2 the lead chiller, add chilled-water supply reset and wet-bulb condenser water reset, as lesson 9 described. Mostly programming, with sensor calibration. Part of it had already been done in the autumn, and its trend data gave a measured basis for the savings.
- Fixing low delta-T. Convert the remaining three-way valves, replace leaking and oversized coil valves with pressure-independent valves, clean the worst coils and correct air handler setpoints, as lesson 7 found. This lets the plant run fewer chillers and less pump flow at part load.
- Tower fan drives and condenser water optimization. Two of the three tower cells still had two-speed motors; variable-speed drives on all cells and an optimized condenser water setpoint would cut fan and chiller energy, as lesson 5 explained.
- A heat-recovery chiller. A 700 kW (200-ton) machine to supply the reheat and domestic hot water preheat loops, as lesson 4 described, avoiding boiler gas at the cost of some electricity.
- Replacing CH-1. A new variable-speed centrifugal with a low-GWP refrigerant, matching CH-2, on the capital plan anyway because of the machine's age and refrigerant.
Estimating the savings
Each measure's saving was estimated with the methods from the lessons: the staging model of lesson 9 for re-sequencing, extended over the year's load profile; the decoupler model of lesson 7 and the pump curves of lesson 8 for low delta-T; tower fan curves and the lift relationship of lesson 3 for the tower measure; the simultaneous heating and cooling data from the hospital's meters for heat recovery; and the part-load ratings of lesson 2 for the replacement chiller. Where the measures overlapped, Theo counted the savings in order, so that, for example, the replacement chiller's saving was calculated after re-sequencing, when CH-1 would already be running fewer hours. That is why its saving was smaller than a simple comparison of CH-1 and a new machine would suggest.
The costs came from quotations and recent similar jobs, with the larger ones marked as budget estimates. Energy prices were the hospital's current rates, and the carbon factors were labelled as assumptions, because they change over time and, for electricity, differ greatly between places. The script brings the results together.
# Riverbend plant study: five measures, annual savings and simple payback (illustrative prices)
elec, gas = 0.14, 0.45                          # $/kWh and $/m3
grid, gas_co2 = 0.040, 1.9                      # kg CO2 per kWh (Ontario, illustrative) and per m3
measures = [  # name, cost $, kWh saved, m3 gas saved
    ("re-sequence: CH-2 lead, chilled water reset", 25000, 410000, 0),
    ("fix low delta-T: valves and coil cleaning", 180000, 520000, 0),
    ("tower fan drives and condenser water reset", 95000, 230000, 0),
    ("heat-recovery chiller for reheat and preheat", 1150000, -250000, 260000),
    ("replace CH-1 with a low-GWP variable-speed machine", 1900000, 610000, 0)]
total_cost = total_save = total_co2 = 0
for name, cost, kwh, m3 in measures:
    save = kwh * elec + m3 * gas
    co2 = (kwh * grid + m3 * gas_co2) / 1000
    total_cost += cost; total_save += save; total_co2 += co2
    print(f"{name:52s} ${save:>9,.0f}/yr  payback {cost / save:4.1f} yr  {co2:5.0f} t CO2")
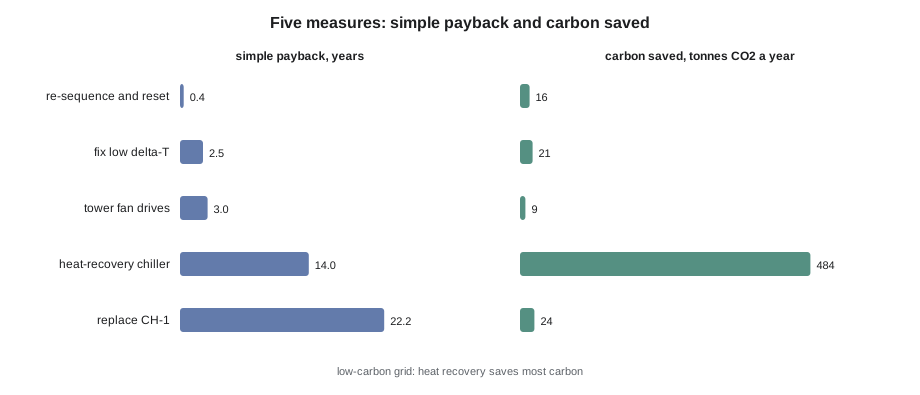
print(f"{'all five':52s} ${total_save:>9,.0f}/yr payback {total_cost / total_save:4.1f} yr {total_co2:5.0f} t CO2")re-sequence: CH-2 lead, chilled water reset $ 57,400/yr payback 0.4 yr 16 t CO2 fix low delta-T: valves and coil cleaning $ 72,800/yr payback 2.5 yr 21 t CO2 tower fan drives and condenser water reset $ 32,200/yr payback 3.0 yr 9 t CO2 heat-recovery chiller for reheat and preheat $ 82,000/yr payback 14.0 yr 484 t CO2 replace CH-1 with a low-GWP variable-speed machine $ 85,400/yr payback 22.2 yr 24 t CO2 all five $ 329,800/yr payback 10.2 yr 555 t CO2
Re-sequencing paid back in under half a year and fixing low delta-T in about two and a half; the tower drives in about three. Together those three cost about $300,000 and saved about $160,000 a year. The heat-recovery chiller had a long payback, about fourteen years at current gas prices, but it saved more carbon than all the others put together, nearly 500 tonnes a year, because Ontario's electricity is very low in carbon and the gas it displaced was not. Replacing CH-1, after the other measures, saved relatively little energy, because CH-1 would by then run only at peak; its payback on energy alone was over twenty years.
Beyond simple payback
Simple payback is a blunt tool. The report added the considerations that numbers alone did not capture:
- Reliability and risk. CH-1 was seventeen years old, with progressing tube wear from lesson 11 and a refrigerant that can no longer be used in new chillers in Canada. Its replacement was justified by risk and the capital plan, not by energy; the study's job was to show that the energy measures should come first and that the new machine could then be selected for a plant that no longer had low delta-T.
- Order. The low delta-T fix and re-sequencing would change how many hours each machine ran, so they should be done before sizing anything new. A replacement chiller selected for the old, low delta-T plant would be wrong for the fixed one.
- Carbon and policy. The hospital's emissions target changed the value of the heat-recovery chiller, which on carbon was the best measure by far, and could qualify for utility or government incentives that would shorten its payback.
- Maintenance and skills. Every measure added equipment or controls that someone had to maintain; the report listed the training and service each one needed.
Theo also wrote what the study did not show: the savings were estimates with uncertainties, especially for low delta-T, and the report recommended measuring each measure's result after it was done, with the same meters, and adjusting the later steps if the results differed.
The recommendation
The report recommended four steps. First, complete the re-sequencing and reset, and finish the low delta-T repairs over the coming summer, which had the fastest paybacks and would change the plant's operation the most. Second, add variable-speed drives to the remaining tower cells. Third, start the design of a heat-recovery chiller, sized from a year of measured simultaneous heating and cooling after the first two steps. Fourth, plan CH-1's replacement for the following year, selecting a variable-speed low-GWP machine for the plant as it would then operate, and recover CH-1's charge for reclamation as RAC-120 described.
Dana's review made three changes. She asked Theo to put the one-page summary first, because the board would read nothing else; to show the savings as ranges rather than single numbers; and to cut every abbreviation that a hospital board member would not know. "The best engineering in the world doesn't help if nobody can read it," she said. Grace presented it to the board in March. The first two steps were approved that day, and the heat-recovery design was approved in the capital plan for the next year.
Looking back over the course
Theo's year at Riverbend followed the path of this course. The plant looked complicated at first, but each problem had a cause that the lessons explained: the surge trip was condenser water held too warm at low load; the second chiller starting early was low delta-T at the coils; the rising condenser approach was a dry chemical feed pump; the starved far building was a closed balancing valve; the missing energy savings of CH-2 were a staging habit. None of them was a broken chiller. Each was found by measuring, comparing with a baseline and asking why.
RAC-420 turns to industrial refrigeration with ammonia and carbon dioxide, where the systems are larger again and the refrigerants bring their own hazards, and RAC-430 brings the whole program together for troubleshooting and the Red Seal exam. The habits from this course carry into both: read the logs, calculate the approaches, follow the water, and find the cause before replacing the part.
Measuring the results
By the end of the summer after the report, the first two steps were finished, and Theo and Anika compared the plant's trends with the baseline at similar loads and weather. The coil delta-T at part load had risen from about 3.9 K to about 6 K, close to what lesson 7's model had assumed. The plant ran one chiller, CH-2, on most days that had needed two the summer before, and the decoupler flowed the right way almost all the time. The whole-plant efficiency over the summer was about 18 % better than the baseline after correcting for weather, within the range the report had given. A few results were disappointing: two air handlers still returned cold water, because their coils were undersized for the warmer chilled water in mild weather, and Theo added them to the list for the next year.
Measuring after the work closed the loop. It showed the board that the money had done what was promised, it found the measures that had fallen short, and it gave the heat-recovery chiller's designers real data instead of estimates. Grace asked for the same comparison to be repeated every year as part of Northfield's contract.
What the technician brings
A plant study is often thought of as an engineer's job, and the design of the heat-recovery chiller and the replacement chiller would be done by consulting engineers. But most of the findings that drove the study came from technicians and operators: the surge trip, the leaking valves, the dry chemical pump, the closed balancing valve, the wrong sensor. The people who maintain a plant see how it really runs. A technician who keeps good records, calculates approaches and asks why a reading has changed is the most valuable source of information an owner has.
Common mistakes
MistakeStarting a plant study by choosing the new equipment.
InsteadMeasure the existing plant and fix operation and distribution first.
MistakeCounting overlapping savings twice.
InsteadCalculate the measures in order, each after the ones before it.
MistakeJudging every measure by simple payback alone.
InsteadConsider reliability, refrigerant, carbon, incentives and maintenance too.
MistakePresenting single-number savings as certain.
InsteadGive ranges, state the methods and measure results afterwards.
MistakeWriting the report for engineers when the decision-makers are not.
InsteadPut a plain one-page summary first.
Summary and key terms
- A plant study starts with a measured baseline of cooling delivered and energy used by each part of the plant.
- Low-cost operational measures, such as sequencing, reset and fixing low delta-T, usually come first and pay back fastest.
- Overlapping measures are evaluated in order so their savings are not double counted.
- Carbon results depend strongly on the electricity grid; heat recovery saves most where electricity is low in carbon.
- Replacement decisions weigh reliability, refrigerant rules and capital plans as well as energy.
- Reports state their methods and uncertainties, recommend measuring results, and put a plain summary first.
- Baseline
- The measured energy use and performance of a system before changes.
- Simple payback
- Cost divided by annual savings, in years.
- Measure
- A specific improvement evaluated in an energy study.
- Interactive effects
- The ways one measure changes the savings of another.
- Carbon factor
- Emissions per unit of energy used, such as kilograms of CO₂ per kilowatt-hour.
- Capital plan
- An owner’s schedule for major equipment replacements and investments.
- Measurement and verification
- Measuring the actual results of a measure after it is installed.
- Low-GWP refrigerant
- A refrigerant with a low global warming potential.
Practice problems
Work each problem on paper first, then reveal the answer to check.
A measure costs $90,000 and saves $30,000 a year. What is its simple payback?
Show answer
Three years.
Why was the replacement chiller's saving smaller than a direct comparison with CH-1 would suggest?
Show answer
It was calculated after re-sequencing, when CH-1 would already run fewer hours.
Why should low delta-T be fixed before selecting a new chiller?
Show answer
Fixing it changes how many hours each machine runs and the flows it needs; a new chiller should suit the fixed plant.
Why did the carbon results differ so much between the Canadian and US versions of the study?
Show answer
The electricity grids have very different carbon factors.
Lesson quiz · 5 questions
Score 60% or more to complete this lesson.
Create a free account to save your progress, take quizzes and earn a certificate.