
PMP-150 · Lesson 3 of 12 · 25 min
Benefits realization
A business case promises benefits; benefits realization is the work of making sure they actually arrive. It starts before the project begins, runs through delivery and continues long after the project team has disbanded. Many organizations are good at delivering outputs and poor at checking whether the expected benefits followed. The result is a portfolio full of projects that were declared successful at closure but never changed anything that mattered. The 2026 outline asks project leaders to make sure a system exists to measure and track benefits, and to examine business value throughout the project. This lesson shows what that looks like in practice.
The benefits life cycle
Benefits realization management is usually described as a cycle of five activities. The names differ between frameworks, but the logic is the same.
| Stage | Main activities | Typical owner |
|---|---|---|
| Identify | Define the benefits the investment should produce and link them to strategic objectives | Sponsor, with business owners |
| Plan | Choose measures, baselines, targets and timing; assign benefit owners; write the benefits management plan | Sponsor and project manager |
| Deliver enablers | Produce the outputs and the business changes the benefits depend on | Project manager and team, with operations |
| Realize and measure | Use the outputs, track measures against targets, act on shortfalls | Benefit owners in operations |
| Sustain | Embed new ways of working so benefits continue; review and report | Operations managers and portfolio office |
The cycle shows why benefits realization cannot be handed entirely to the project team. The team can deliver the enablers and help set up measurement, but realizing and sustaining benefits happens in operations, after handover. That is why every benefit needs a named owner who will still be accountable when the project is closed.
Mapping benefits
A benefits map, sometimes called a benefits dependency network, traces how project outputs lead to business changes, how those changes lead to benefits and how benefits support strategic objectives. Reading it from right to left asks: which objective, which benefits, which changes, which outputs? Reading it from left to right checks that every output contributes to something valued. Outputs that connect to nothing are candidates for removal; benefits with no enabling output reveal missing scope.
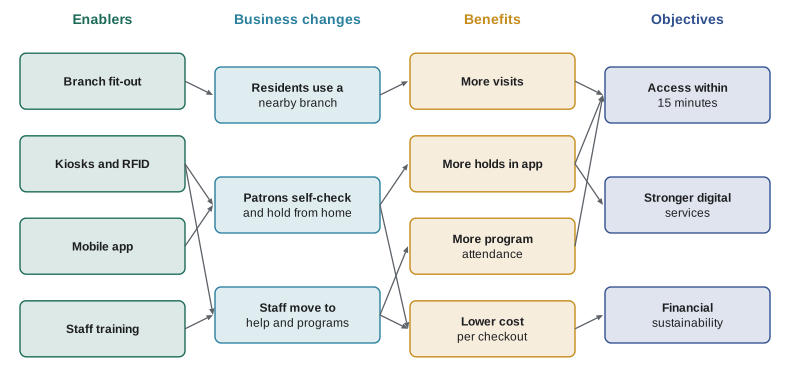
Two points stand out on the Compass map. First, several benefits depend on business changes that are not project outputs at all: staff must actually move from routine checkouts to programs for the program attendance benefit to appear, and that depends on scheduling decisions by the branch manager and agreement with the union. Second, the app contributes to two objectives, which is one reason it was kept in scope when the budget was tight.
Choosing measures, baselines and targets
Each benefit needs a measure that can actually be collected, a baseline describing the situation before the change, a target and a date. Good measures are specific, available at reasonable cost and hard to game. Where the true benefit is hard to measure directly, organizations use a proxy and say so.
| Benefit | Measure | Baseline | Target and date | Owner |
|---|---|---|---|---|
| Better access on the east side | Visits to Eastgate per year | 0 (no branch) | 110,000 in year 1; 140,000 by year 2 | Owen Tran, Eastgate branch manager |
| More use of digital services | Share of Eastgate holds placed in the app | Systemwide 18 % of holds online (web) | 40 % by month 6 after opening | Amara Osei, digital services manager |
| More community programming | Program attendance at Eastgate per year | 0 | 9,000 by year 2 | Owen Tran |
| Lower cost per transaction | Staff minutes per checkout across the system | 1.6 minutes | 1.1 minutes by year 2 | Director of branch services |
| New residents connected | New cardholders with east-side addresses | About 900 a year | 4,000 extra in the first two years | Owen Tran |
Some benefits are disbenefits in disguise. A disbenefit is a measurable negative consequence that a stakeholder perceives as a loss, such as longer queues at a neighbouring branch while staff are trained, or reduced in-person contact for patrons who prefer a staffed desk. Recording disbenefits honestly, with owners and mitigations, is part of the same discipline.
The benefits management plan and register
The benefits management plan describes how benefits will be identified, measured, reported and sustained, and who is responsible. It typically covers the target benefits and their link to strategy, measures and data sources, timing of measurement, owners, assumptions and risks, and how benefits will be handed to operations. The benefits register is the living list of individual benefits with their measures, baselines, targets, owners and current status. In a program, the register is usually maintained by the program; on a stand-alone project it often sits with the project manager until handover, then moves to the business owner or portfolio office.
Tracking benefits after opening
Eastgate opened in the autumn. The business case expected about 110,000 visits in the first year, starting at around 7,000 a month and ramping up to over 10,000 as the neighbourhood discovered the branch. Owen Tran tracked actual visits against that trajectory each month.
# Eastgate visits in the first nine months after opening against the business case trajectory.
# The business case expects 110,000 visits in year 1, ramping from 7,000 to 10,500 a month.
forecast = [7000, 7600, 8100, 8500, 8900, 9300, 9600, 9900, 10200]
actual   = [8200, 7900, 7700, 7900, 8300, 8600, 8800, 9000, 9100]
cum_f = cum_a = 0
print("Month  Forecast  Actual  Cumulative %")
for m, (f, a) in enumerate(zip(forecast, actual), start=1):
    cum_f += f; cum_a += a
    print(f"{m:>5}  {f:>8,}  {a:>6,}  {100 * cum_a / cum_f:>11.0f}%")
recent = sum(actual[-3:]) / sum(forecast[-3:])
print(f"Last three months at {100 * recent:.0f}% of forecast")Month Forecast Actual Cumulative %
1 7,000 8,200 117%
2 7,600 7,900 110%
3 8,100 7,700 105%
4 8,500 7,900 102%
5 8,900 8,300 100%
6 9,300 8,600 98%
7 9,600 8,800 97%
8 9,900 9,000 96%
9 10,200 9,100 95%
Last three months at 91% of forecastThe early months ran ahead of forecast, helped by the opening events, but from month 3 visits fell behind and the gap widened. Cumulative visits were still at 95 % of forecast after nine months, which a quick glance at a cumulative figure might read as almost on track. The monthly view is more worrying: the last three months ran at 91 % of forecast and the trend was flattening rather than ramping up. Looking only at cumulative numbers can hide a trend, which is why benefit owners usually track both.
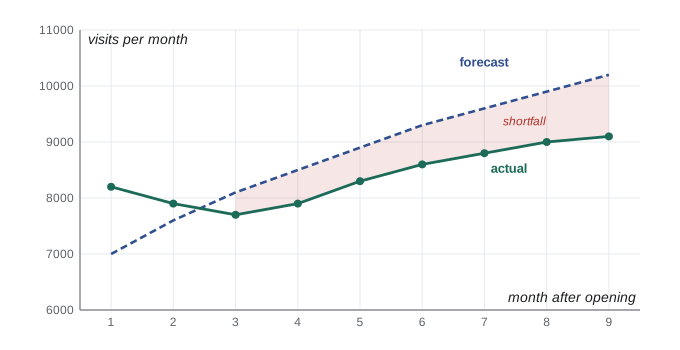
Owen investigated. The bus route that the business case assumed would be extended to Eastgate had been delayed by the transit agency, and weekend hours were shorter than planned because of a staffing gap. Neither was a project failure; both were assumptions in the business case that had not held. The response was operational: the library added a shuttle on Saturdays for a trial period and reopened recruitment. The benefits register recorded the shortfall, the causes and the actions, and the portfolio office used it to adjust visit forecasts for the next branch business case.
Benefits in adaptive and hybrid projects
Adaptive approaches bring benefits closer to delivery. Because features are released incrementally, some benefits start appearing during the project, and the team can measure outcomes and adjust the backlog in response. The Compass app team tracked the share of holds placed through the app from the first pilot release, which gave early warning that the account login step was putting people off. Fixing it in the next sprint was far cheaper than discovering the problem after the project closed.
A useful technique is to state outcomes in the backlog explicitly, for example as objectives and key results, and to review them at sprint or release reviews alongside the features delivered. This keeps the team focused on whether people are using the product, not just whether it was built. Lesson 5 returns to outcome-based governance.
Handing benefits over
At closure, the project hands over not just the outputs but the means to keep tracking benefits: the register, the data sources and reports, the measurement schedule and the names of owners who have agreed to take responsibility. A short benefits handover meeting, recorded in the closure report, avoids the common situation where nobody measures anything after the project team disbands. Many organizations schedule a post-implementation or benefits review six to twelve months after handover, run by the portfolio office or the sponsor, to check whether the benefits arrived and what the organization learned.
Worked problem
Who acts on a benefits shortfall?
Six months after a new self-service system goes live, the benefit owner reports that staff time per transaction has fallen by only half of the target. The project closed three months ago. The former project manager is now running another project. What should happen?
Show solution
- The benefit belongs to the business owner named in the benefits register, who remains accountable after closure.
- The owner should investigate causes: is the system being used as intended, have processes changed, are assumptions still valid?
- Actions may be operational (training, process changes, staffing) or may need a small follow-on project, decided through the normal portfolio process.
- The former project manager may be consulted for knowledge but does not own the benefit or the response.
Answer: The benefit owner investigates and acts, using the benefits register and reporting to the sponsor or portfolio office; the former project manager supports if asked.
Benefits in programs and portfolios
When a project sits inside a program, benefits are often managed at program level, because several projects contribute to the same benefits and no single project can claim them alone. Eastgate is part of the library's branch network renewal program, which also includes a refurbished downtown branch and a new delivery service between branches. The program manager keeps a program benefits register that rolls up the benefits from each project and shows which projects enable which benefits. Project Compass contributes the Eastgate visits and app adoption benefits, but the systemwide reduction in staff minutes per checkout depends on self-checkout being rolled out to other branches by later projects in the program.
At portfolio level, the portfolio office uses benefits data to compare how well different investments are paying off and to improve future forecasts. Over time, this creates a feedback loop: business cases that consistently overstate benefits become visible, and estimating improves. For the exam, remember that benefits realization is not a single activity at the end of a project; it connects strategy, portfolio selection, program coordination, project delivery and operations.
Common mistakes
MistakeDeclaring success at closure because outputs were delivered.
InsteadPlan to measure benefits after handover and assign owners who will still be accountable.
MistakeLeaving benefits without baselines.
InsteadRecord the starting point so improvement can be measured.
MistakeTracking only cumulative figures.
InsteadWatch monthly trends too; cumulative numbers can hide a deteriorating trend.
MistakeIgnoring disbenefits.
InsteadRecord negative consequences with owners and mitigations.
MistakeMaking the project manager accountable for benefits years after closure.
InsteadBenefit owners in the business are accountable; the project manager delivers enablers and hands over.
Summary and key terms
- Benefits realization runs through identify, plan, deliver enablers, realize and measure, and sustain.
- A benefits map links outputs to business changes, benefits and strategic objectives, exposing gaps and unnecessary outputs.
- Each benefit needs a measure, baseline, target, date and named business owner.
- The benefits management plan explains how benefits are managed; the benefits register tracks each one.
- Eastgate visits fell behind forecast because business case assumptions did not hold; the owner acted operationally.
- Adaptive delivery lets benefits be measured during the project and the backlog adjusted in response.
- Benefits realization management
- The practices that make sure an investment's expected benefits are identified, delivered, measured and sustained.
- Benefits map
- A diagram linking outputs to business changes, benefits and objectives.
- Benefit owner
- The person in the business accountable for realizing a benefit.
- Benefits management plan
- The document describing how benefits will be measured, reported and sustained.
- Benefits register
- A list of benefits with measures, baselines, targets, owners and status.
- Disbenefit
- A measurable negative consequence perceived as a loss by a stakeholder.
- Baseline
- The measured starting point against which improvement is judged.
- Post-implementation review
- A review some months after handover that checks whether benefits were achieved.
Practice problems
Work each problem on paper first, then reveal the answer to check.
Name the five stages of the benefits life cycle.
Show answer
Identify, plan, deliver enablers, realize and measure, sustain.
What does an output with no link on the benefits map suggest?
Show answer
It may be unnecessary scope.
What four things does each benefit need besides an owner?
Show answer
A measure, a baseline, a target and a date.
Who owns the app adoption benefit for Eastgate?
Show answer
Amara Osei, the digital services manager.
After nine months, cumulative visits were 95 % of forecast. Why was that misleading?
Show answer
The monthly trend had fallen to about 91 % and was flattening.
What caused the Eastgate shortfall?
Show answer
A delayed bus route extension and shorter weekend hours, both business case assumptions.
Give an example of a disbenefit.
Show answer
Longer queues at a neighbouring branch during staff training.
When is a post-implementation review commonly held?
Show answer
Six to twelve months after handover.
How do adaptive approaches help benefits realization?
Show answer
Benefits start appearing during the project and outcomes can steer the backlog.
What should be handed over at closure besides outputs?
Show answer
The benefits register, data sources, measurement schedule and agreed owners.
Lesson quiz · 5 questions
Score 60% or more to complete this lesson.
Create a free account to save your progress, take quizzes and earn a certificate.