
PMP-140 · Lesson 8 of 12 · 25 min
Prioritization and relative estimation
A backlog is only useful if it is in the right order, and ordering depends on two things: how valuable each item is and how big it is. This lesson covers the techniques agile teams use to judge value and urgency, and the relative estimation methods they use to judge size. Exam questions often describe a team arguing about priorities or estimates and ask what the project manager or agile lead should do; the answers depend on knowing which technique fits and who should be making the call.
Who prioritizes
In Scrum, the product owner orders the product backlog. That does not mean deciding alone. A good product owner gathers input from stakeholders, considers the team's view of technical risk and dependencies, and uses data from reviews and real usage. The project manager in a hybrid project helps by facilitating prioritization workshops, bringing in project-level constraints such as contract dates and integration milestones, and making sure the sponsor's priorities are understood. What the project manager should not do is override the product owner's order or let the loudest stakeholder win.
Ordering considers more than value. Risk reduction matters: doing an uncertain item early can reveal problems while there is still time to react. Dependencies matter: the catalogue connection must exist before most other features can be tested. Learning matters: an experiment that tells the team whether patrons want a feature can save months of building the wrong thing. And cost of delay matters, as explained below.
MoSCoW
MoSCoW, from DSDM, sorts requirements for a given timebox or release into must have, should have, could have and won't have this time. Must haves are the minimum without which the release is pointless or unlawful; should haves are important but there is a workaround; could haves are desirable if time permits; won't haves are explicitly out of this release, which is useful for managing expectations. DSDM guidance suggests that must haves should not take more than about 60 % of the effort for a timebox, leaving contingency in the should and could categories; if everything is a must have, the categories have failed.
| Category | Meaning | Compass release 1 examples |
|---|---|---|
| Must have | Release fails without it; legal or safety requirement | Search and availability, place a hold, sign in, accessibility to WCAG 2.1 AA |
| Should have | Important, but a workaround exists | Holds queue position, renewals |
| Could have | Nice to have if time allows | Reading history, dark mode |
| Won't have (this time) | Agreed out of this release | Room booking, event sign-up (release 2) |
The Kano model
Noriaki Kano's model classifies features by how they affect customer satisfaction. Basic (must-be) features cause dissatisfaction if missing but little delight if present: patrons expect to be able to sign in. Performance (one-dimensional) features increase satisfaction roughly in proportion to how well they are done: faster search is better. Excitement (attractive) features delight when present but are not missed when absent, at least at first: a notification that the item is ready, with the shelf location. Indifferent features make little difference either way. Over time, excitement features tend to become expected, so the categories shift.
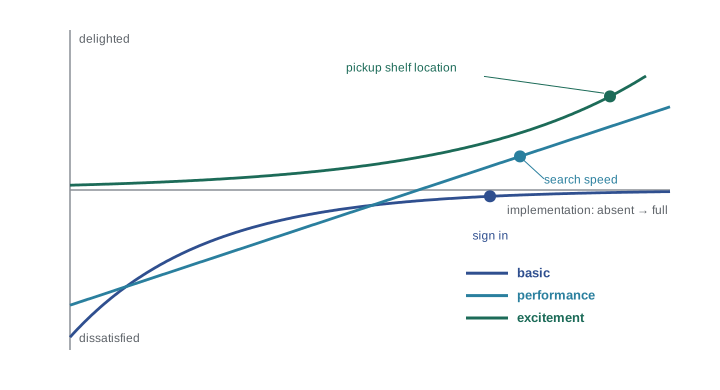
Kano helps a product owner avoid two errors: neglecting basic features because nobody asks for them, and filling a release with performance features while ignoring the small delights that make a product memorable. It is usually informed by short surveys asking users how they would feel if a feature were present and if it were absent.
Cost of delay and WSJF
Cost of delay is the value lost by delivering something later rather than sooner. Some items lose value quickly (a feature needed for a fixed launch event, a legal requirement with a deadline), others barely at all. Weighted shortest job first (WSJF), popularized by Don Reinertsen and used in SAFe, orders items by cost of delay divided by job size, so that small items with high urgency go first. In SAFe's version, cost of delay is approximated by adding relative scores for user or business value, time criticality, and risk reduction or opportunity enablement.
# Weighted shortest job first: cost of delay / job size (relative scores, Fibonacci-like).
items = {  # name: (user value, time criticality, risk reduction or opportunity, size)
    "Hold pickup notifications": (8, 8, 3, 5),
    "Room booking":              (5, 3, 2, 8),
    "Accessibility fixes":       (8, 13, 8, 3),
    "Dark mode":                 (3, 1, 1, 2),
    "Catalog sync caching":    (3, 5, 13, 5),
}
ranked = sorted(items.items(), key=lambda kv: -sum(kv[1][:3]) / kv[1][3])
for name, (v, t, r, size) in ranked:
    cod = v + t + r
print(f"{name:<27} CoD {cod:>2} / size {size:>2} = WSJF {cod / size:.1f}")Accessibility fixes CoD 29 / size 3 = WSJF 9.7 Catalog sync caching CoD 21 / size 5 = WSJF 4.2 Hold pickup notifications CoD 19 / size 5 = WSJF 3.8 Dark mode CoD 5 / size 2 = WSJF 2.5 Room booking CoD 10 / size 8 = WSJF 1.2
Accessibility fixes jump to the top: they are urgent because release 1 cannot go live without them, they reduce legal risk and they are small. Catalogue sync caching, a technical item, ranks second because it reduces a significant performance risk. Room booking, valuable but large and not time-critical for release 1, comes last. The calculation uses relative scores, so its value lies in structuring the conversation, not in the decimal places. Amara used it to explain to the branch manager why room booking would wait.
Other prioritization techniques
| Technique | How it works | When it helps |
|---|---|---|
| Value versus effort (or risk) matrix | Plot items on two axes and start with high value, low effort | Quick visual triage of many items |
| 100-point method | Each stakeholder distributes 100 points among items | Revealing relative preferences among several stakeholders |
| Paired comparison | Compare items two at a time; count wins | A small number of items with hard trade-offs |
| Buy a feature | Stakeholders get play money to buy features with prices based on size | Engaging stakeholders in trade-offs |
| Relative weighting | Score benefit, penalty for absence, cost and risk | Structured comparison with several criteria |
Why estimate relatively
People are poor at estimating absolute durations for uncertain work but reasonably good at comparing sizes: we may not know how many hours a story will take, but we can usually tell that it is about twice as big as another. Relative estimation exploits this. Story points are a unitless measure of the relative size of an item, combining the amount of work, its complexity and its uncertainty. A team picks a reference story, calls it, say, 3 points, and sizes others against it. Many teams use a modified Fibonacci scale (1, 2, 3, 5, 8, 13, 20, 40, 100) because the growing gaps reflect growing uncertainty in larger items.
Story points only mean something within one team. Team A's 5 points are not comparable to Team B's 5 points, and converting points to hours or comparing velocities between teams undermines the whole idea. Managers who want a common measure across teams should look at outcomes, throughput or cycle time rather than points.
Planning poker and other techniques
Planning poker is a consensus-based technique similar to the wideband Delphi method. The product owner reads a story and answers questions. Each developer privately picks a card with their estimate, and all reveal at once, so that nobody anchors on anyone else. If the estimates differ widely, the highest and lowest estimators explain their reasoning, and the team votes again. The discussion is the point: a developer who estimates 13 when others say 3 may know about a hidden complication, or may have misunderstood the story.
| Technique | How it works | Best for |
|---|---|---|
| Planning poker | Private estimates revealed together, discuss outliers, re-vote | Refinement of a modest number of stories |
| T-shirt sizing | XS, S, M, L, XL | Rough sizing of epics or early roadmaps |
| Affinity estimation | Arrange many items on a wall from small to large, then group into sizes | Sizing a large backlog quickly |
| Ideal days | Days of uninterrupted work an item would take | Teams new to relative estimation |
| Counting items (no estimates) | Split items to similar small size and count throughput | Mature teams with consistent slicing |
When the Compass team sized the "hold pickup notifications" story, Sana and Ravi showed 3, Luc and Tess 5 and Mei 13. Mei explained that the library's catalogue only reports hold status changes in an overnight batch, so real-time notifications would need a new integration. The team agreed to split the story: email notifications using the overnight batch (3 points) and real-time notifications after an interface change (8 points, to be confirmed by a spike). Without the private reveal, Mei might have kept quiet.
Uncertainty and the cone
Estimates are more uncertain early. The cone of uncertainty, an idea from software estimation research, illustrates that estimates made at the start of a project can be off by a large factor, narrowing as requirements, design and code take shape. Agile teams respond by estimating small items near the top precisely, large items further down roughly, and re-forecasting every sprint from actual velocity. A forecast should be stated as a range or probability, not a promise; lesson 9 shows how.
Worked problem
The loudest stakeholder
At a prioritization workshop, the head of children's services insists that a reading-challenge feature for children be added to release 1. She is senior and persuasive, and the room seems to agree. The product owner looks uncertain. What should the project manager do?
Show solution
- Prioritization belongs to the product owner; the project manager's job is to support a fair, evidence-based decision.
- Suggest a structured technique, such as WSJF or MoSCoW against the release 1 goal, so the feature is compared with others on the same criteria.
- Make the capacity constraint visible with the release burn-up: adding the feature means something else moves to release 2.
- Let the product owner decide, record the decision and its reasons, and make sure the head of children's services knows when the feature is likely to be delivered.
Answer: Facilitate a structured comparison and show the trade-off, then support the product owner's decision rather than letting seniority decide.
Estimation in a hybrid project
Relative estimates and predictive estimates can coexist in one project, but they should not be mixed carelessly. The Compass project manager kept the fit-out in currency and working days, estimated bottom-up and tracked with earned value, and kept the app in story points tracked with velocity. When the board needed a single cost forecast, she converted at the level of the team rather than the story: the app team cost a known amount per sprint, so the forecast number of sprints, taken from the release forecast, gave a cost range. That conversion respects what points are good for, forecasting a team's capacity, without pretending that each point equals a fixed number of dollars or hours.
Estimates also need to be revisited. As the team learns, the size of items lower in the backlog can change substantially, and re-estimating them in refinement is normal rather than a sign of failure. What the team should avoid is re-estimating completed items after the fact to make velocity look better, which destroys the historical data that forecasts rely on.
Common mistakes
MistakeLetting the most senior or vocal stakeholder set priorities.
InsteadSupport the product owner with structured techniques and visible trade-offs.
MistakeMarking most items as must haves.
InsteadKeep must haves to the true minimum, roughly 60 % of effort or less.
MistakeComparing story points or velocity between teams.
InsteadPoints are relative within a team; compare outcomes or flow instead.
MistakeAveraging planning poker estimates without discussion.
InsteadDiscuss outliers; they often reveal hidden information.
MistakeConverting points to hours for detailed tracking.
InsteadUse points for team forecasting; track progress with working increments.
Summary and key terms
- The product owner orders the backlog, using stakeholder input, risk, dependencies, learning and cost of delay.
- MoSCoW sorts items into must, should, could and won't have this time.
- Kano distinguishes basic, performance, excitement and indifferent features.
- WSJF orders by cost of delay divided by job size.
- Story points are relative, unitless and meaningful only within one team.
- Planning poker uses private estimates and discussion of outliers; affinity estimation sizes many items fast.
- Estimates narrow as work progresses; forecasts should be ranges.
- MoSCoW
- Prioritization into must have, should have, could have and won't have this time.
- Kano model
- A model classifying features by their effect on customer satisfaction.
- Cost of delay
- The value lost by delivering something later.
- WSJF
- Weighted shortest job first: cost of delay divided by job size.
- Story point
- A unitless measure of the relative size of a backlog item.
- Planning poker
- A consensus estimation technique with private votes revealed together.
- Affinity estimation
- Sizing many items by arranging them relative to one another.
- Cone of uncertainty
- The idea that estimate uncertainty is greatest early and narrows over time.
Practice problems
Work each problem on paper first, then reveal the answer to check.
Who orders the product backlog?
Show answer
The product owner.
What does the W in MoSCoW mean?
Show answer
Won't have this time.
Which Kano category causes dissatisfaction if missing but little delight if present?
Show answer
Basic (must-be).
How is WSJF calculated?
Show answer
Cost of delay divided by job size.
Why are story points not comparable between teams?
Show answer
Each team calibrates points against its own reference stories.
Why reveal planning poker cards at the same time?
Show answer
To avoid anchoring on others' estimates.
Which technique sizes a large backlog quickly?
Show answer
Affinity estimation (or t-shirt sizing for rough sizes).
Why did the notifications story get split?
Show answer
An outlier estimate revealed that real-time status needed a new integration.
What share of effort should must haves usually take, according to DSDM guidance?
Show answer
No more than about 60 %.
What does the cone of uncertainty suggest about early estimates?
Show answer
They are much less certain and should be stated as ranges.
Lesson quiz · 5 questions
Score 60% or more to complete this lesson.
Create a free account to save your progress, take quizzes and earn a certificate.